

Analytics
On this page
Twigex Data helps businesses manage, analyze, and visualize large amounts of data from multiple sources. It turns raw data into actionable insights with powerful workflows, advanced visuals, and simple access controls.
While it seamlessly integrates with solid, well-structured databases, advanced users can enhance workflows for data extraction, transformation, or fixing gaps in existing setups.
Getting started
When you first open Twigex Data, you'll be greeted with a clean and intuitive interface guiding you to create your first workspace. A workspace acts as the central hub where you manage deployments, data models, visualizations, user access, and more.
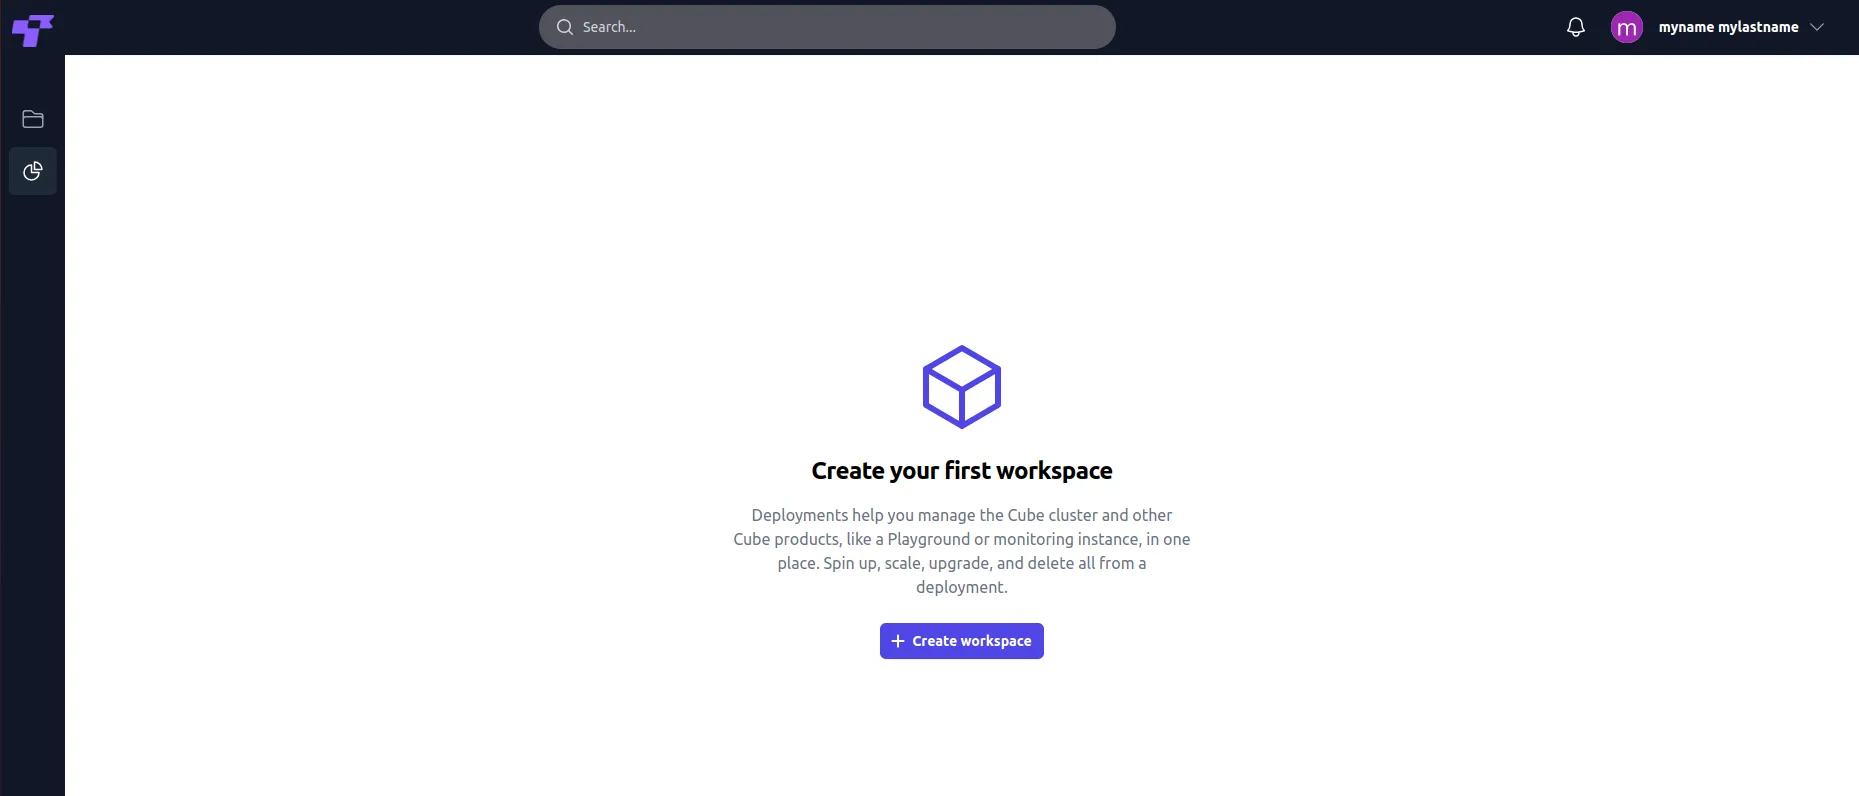
Click "+ Create workspace"
This launches the setup process for your workspace.
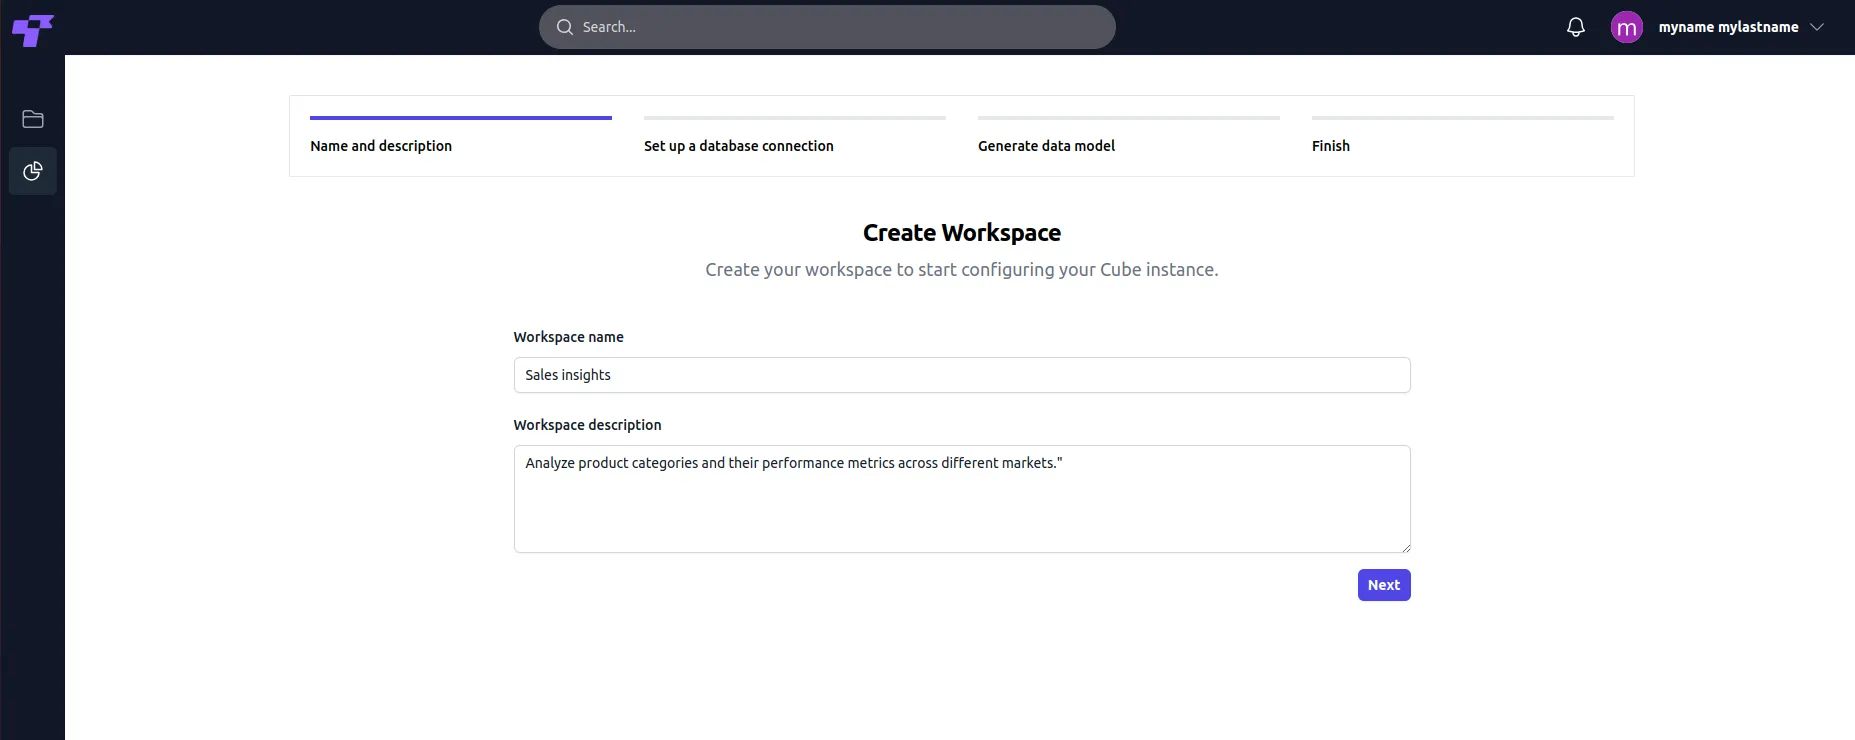
Add a name and description
- Workspace name: Choose a descriptive and clear name that aligns with your project's goals.
- Workspace description: Detail the purpose of the workspace to help you and your team understand its focus.
Click Next. This action saves your workspace details and progresses to the database connection step.
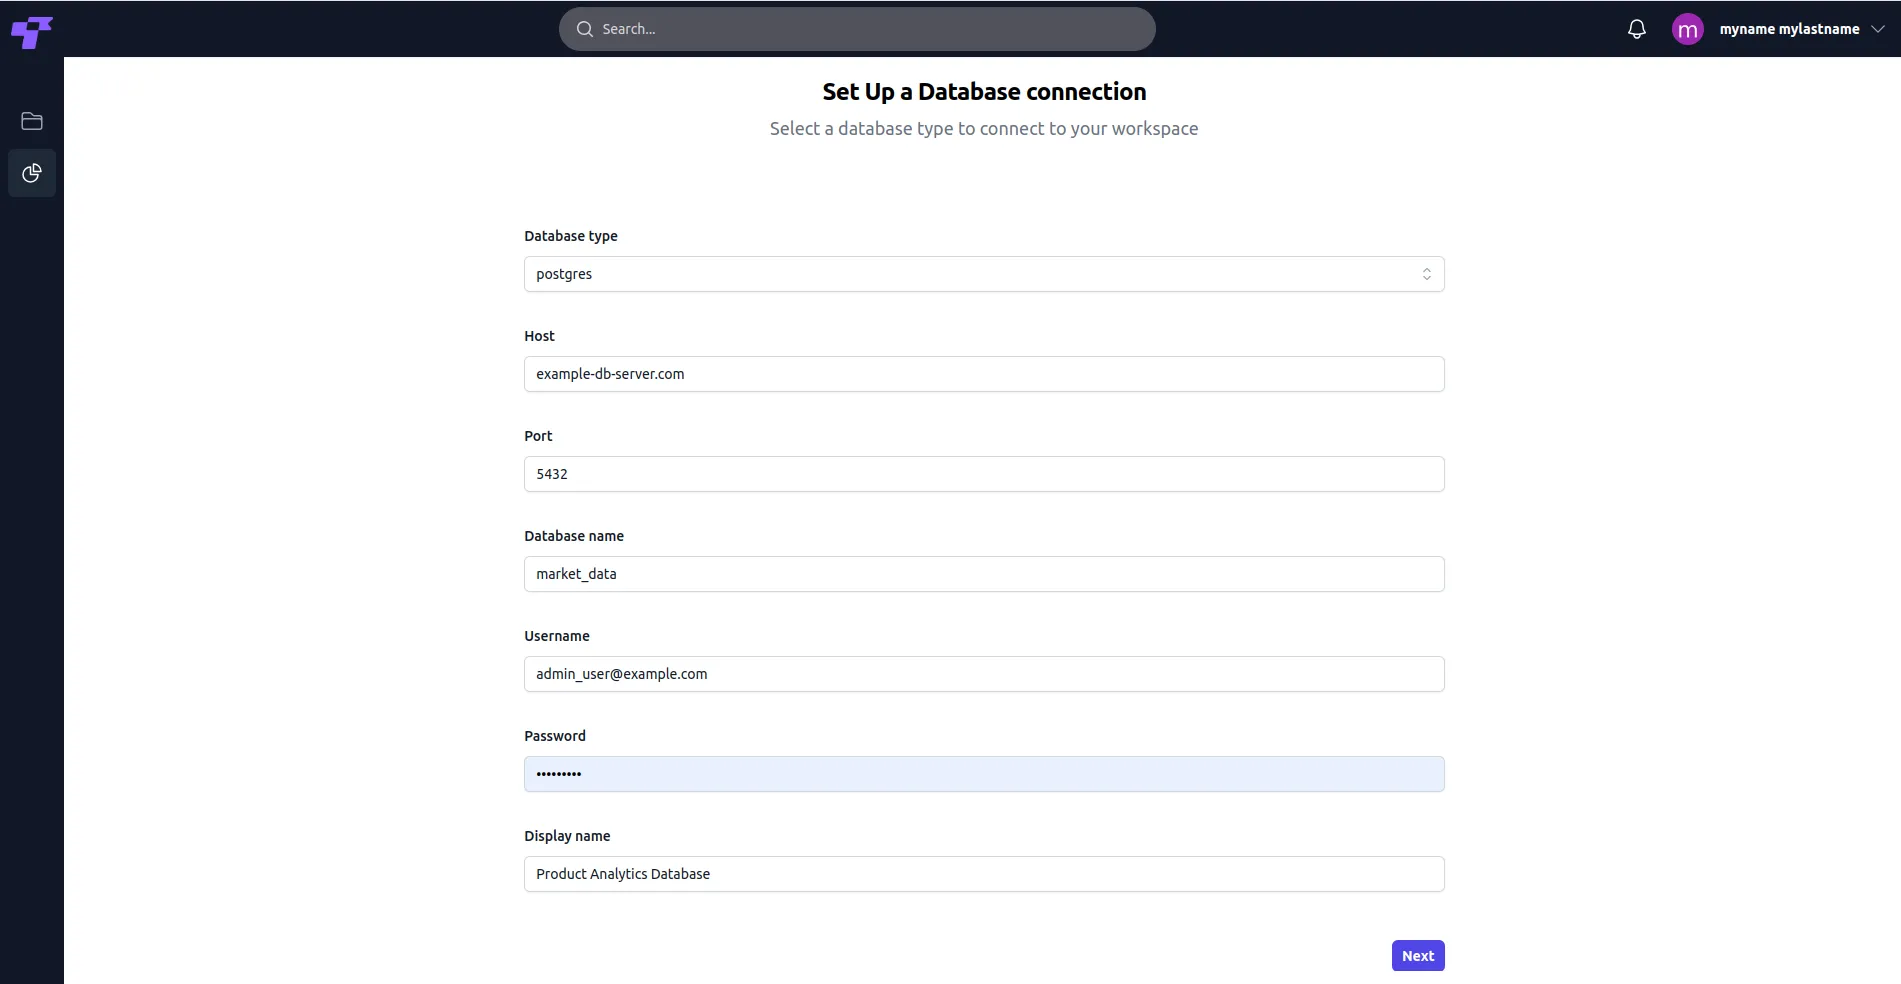
Set up a database connection
- Select database type: From the dropdown menu, choose the type of database you wish to connect. Twigex Data supports PostgreSQL, MySQL, and StarRocks.
- Enter host details: Provide the hostname or IP address where your database is hosted.
- Enter port number: Specify the port used to access the database. The default port for PostgreSQL is 5432, while MySQL typically uses 3306.
- Provide database name: Enter the name of the database you wish to access.
- Add username and password: Your database user account and password.
- Assign a display name: This name will appear within your workspace for easy recognition.
Click Next. Once all details are entered, click the Next button to proceed. Twigex Data will test the connection before moving to the next step.
Generate a data model from your database
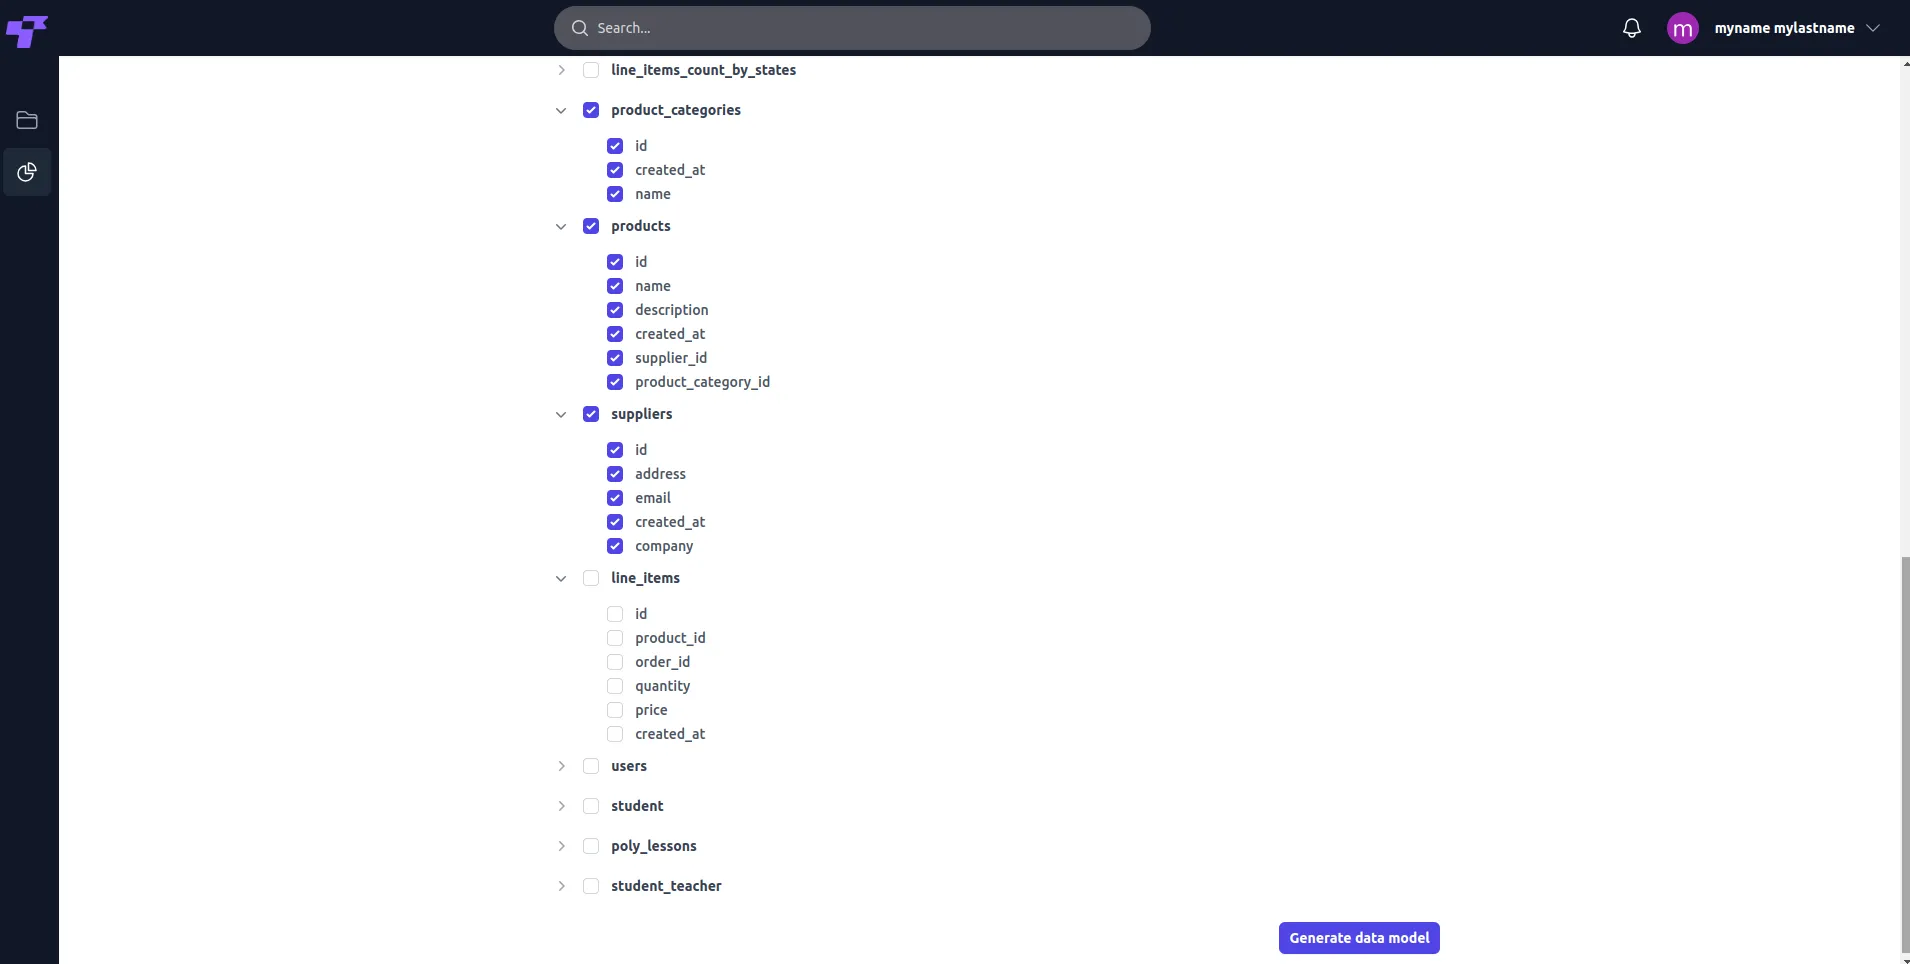
- Expand tables: Click the dropdown arrow next to each table to reveal its fields.
- Select relevant fields: Check the fields necessary for your analysis. Exclude irrelevant fields to keep the data model efficient.
After selecting the desired fields, click the Generate Data Model button to proceed.
Generating the model may take a few minutes. Please wait and don't close the window.
Connections
In this section, you can get an overview of all your added databases.
- Click New Connection in the top right to open the connection form, then fill in the database details as described above in Getting started.
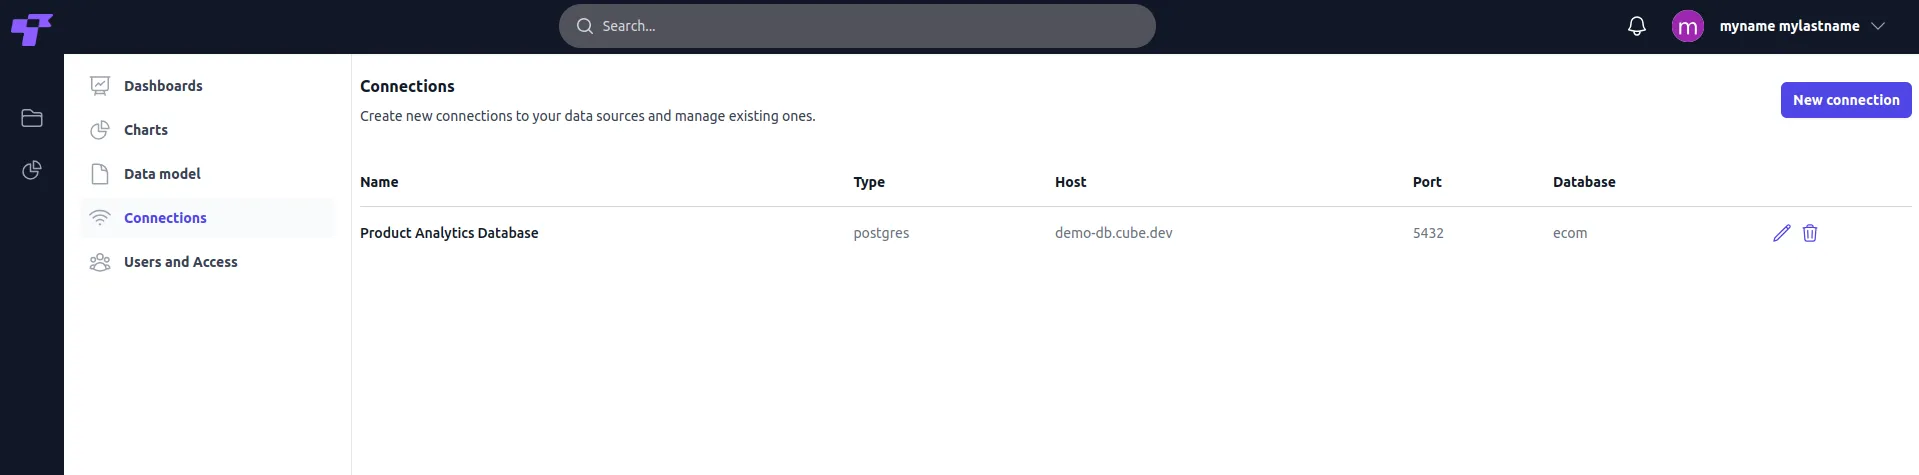
- Click the pencil icon in the Actions column to modify the connection details.
- Click the trash icon to permanently delete an unwanted connection.
This action cannot be undone. All of your data will be permanently removed from the server.
Data model
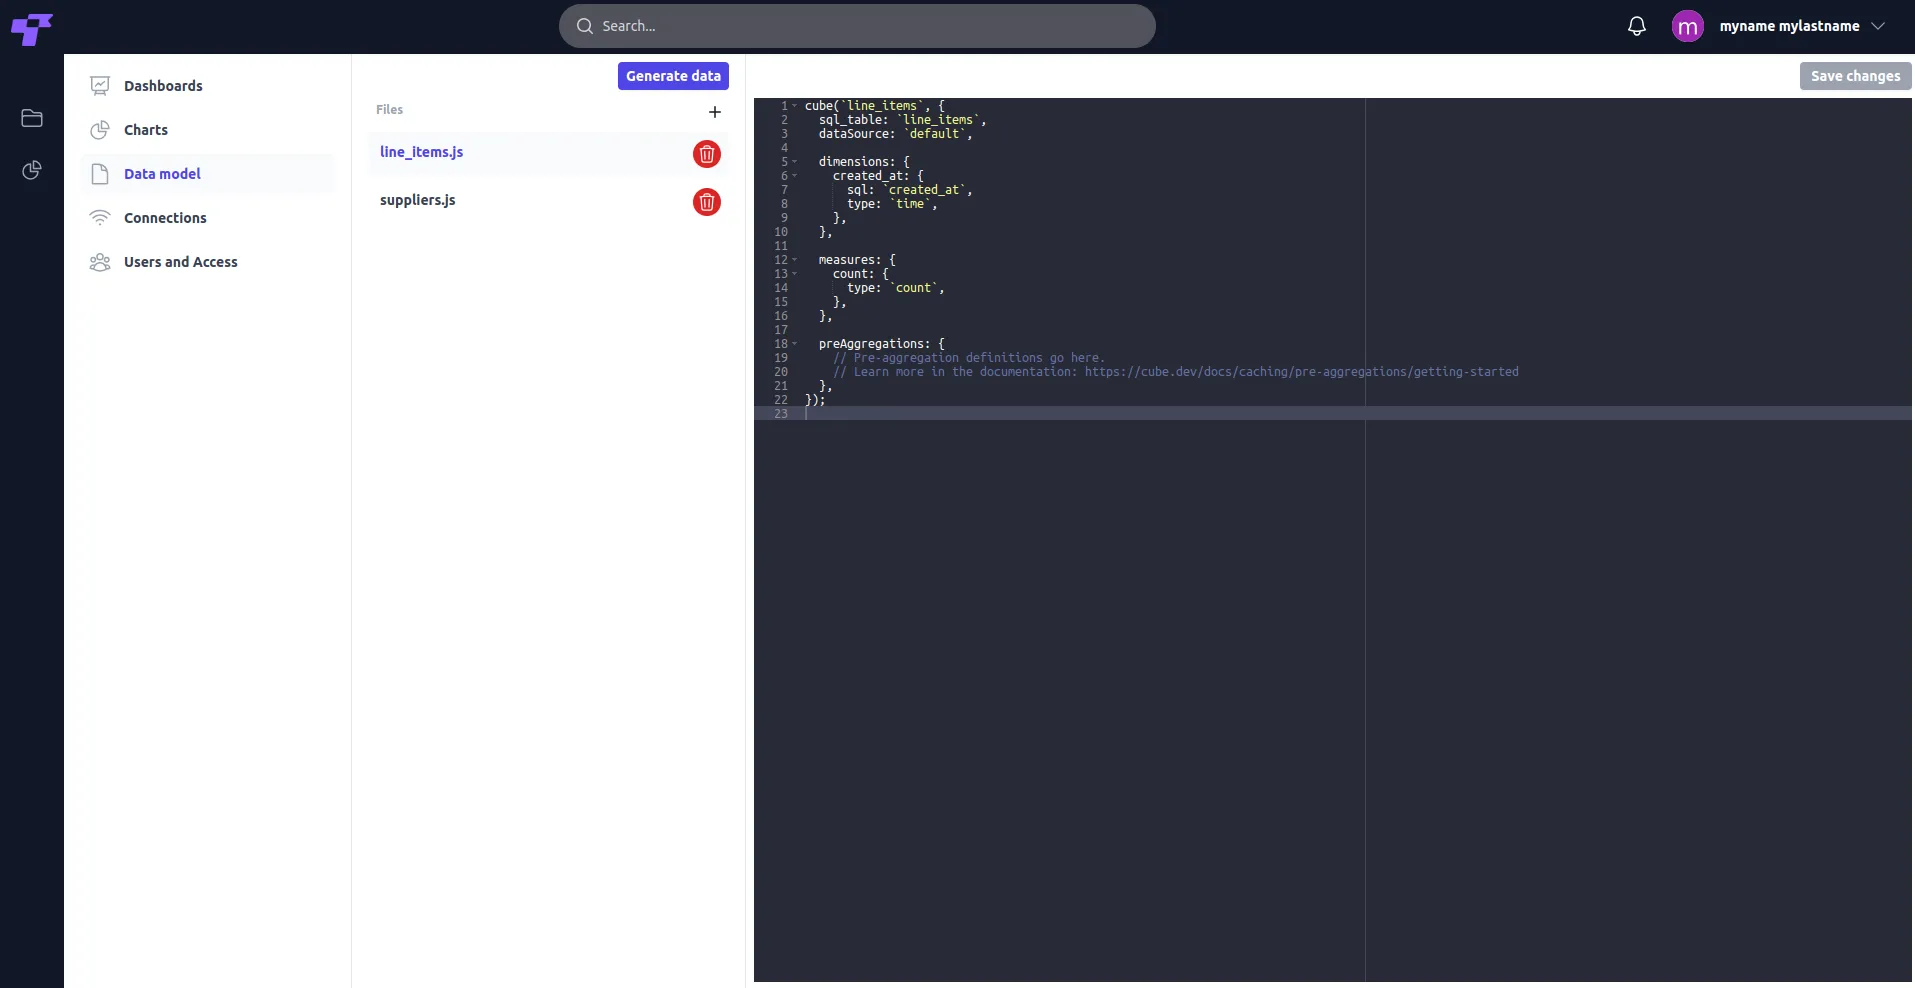
The Data Models section lets you define and organize your data structure, making it easier to query, visualize, and analyze. It's where you create and manage Cube.js models, forming the foundation for analytics.
- File list panel (left side): Displays a list of files representing the individual data models. Each file corresponds to a table or entity in the database.
Remove any unnecessary files by clicking the delete icon next to them.
- Code editor (right side): Provides a live editing interface for Cube.js data model definitions. Users can write or modify JavaScript-based cube definitions to reflect their database schema and relationships.
Generating data models
Creating data files
- Click the Generate data button at the top of the Data Models section to create new data files. A dialog box will appear displaying a list of available tables or data sources.
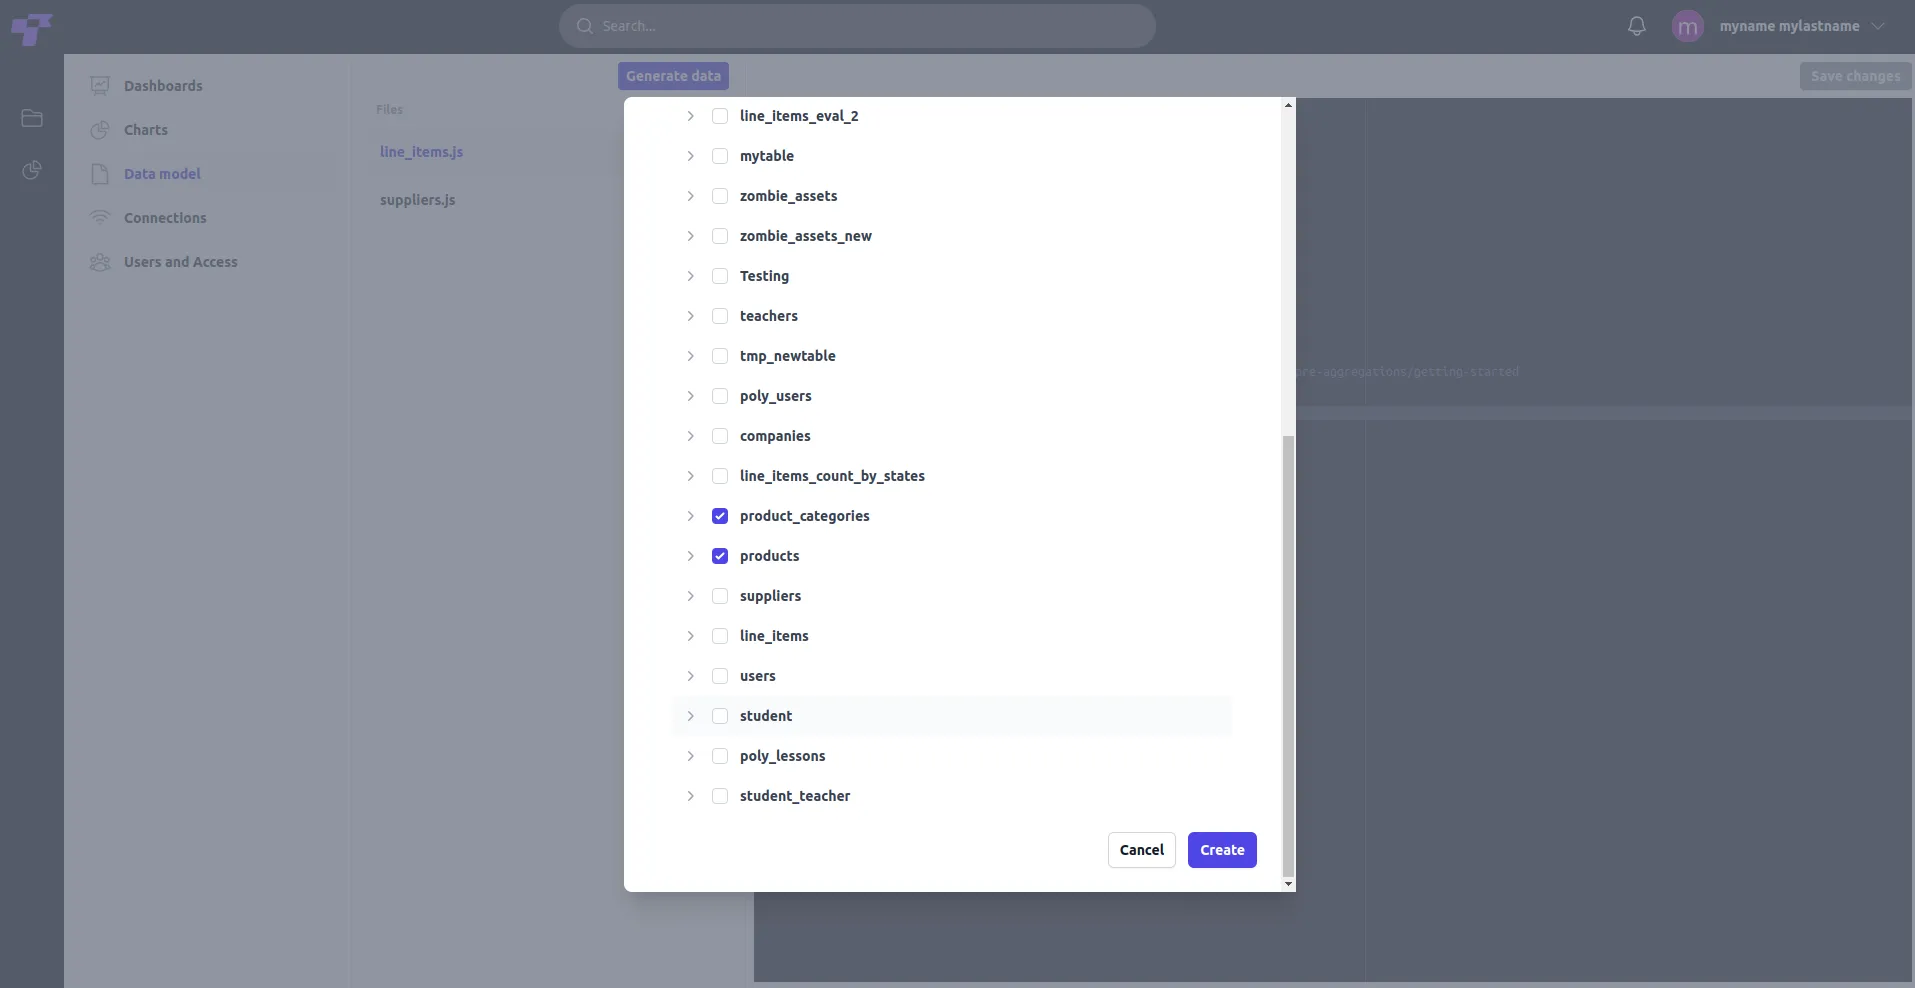
- Select the relevant tables you want to include in your data model by checking their respective boxes.
- Click the Create button to initiate the generation process. Once the data generation is complete, the selected models will be available for use in building dashboards, charts, and queries.
Please note that this process may take a few seconds to several minutes.
Editing and customizing data models
The right panel contains the selected file's code, where you can modify dimensions, measures, and joins to refine how your data is modeled.
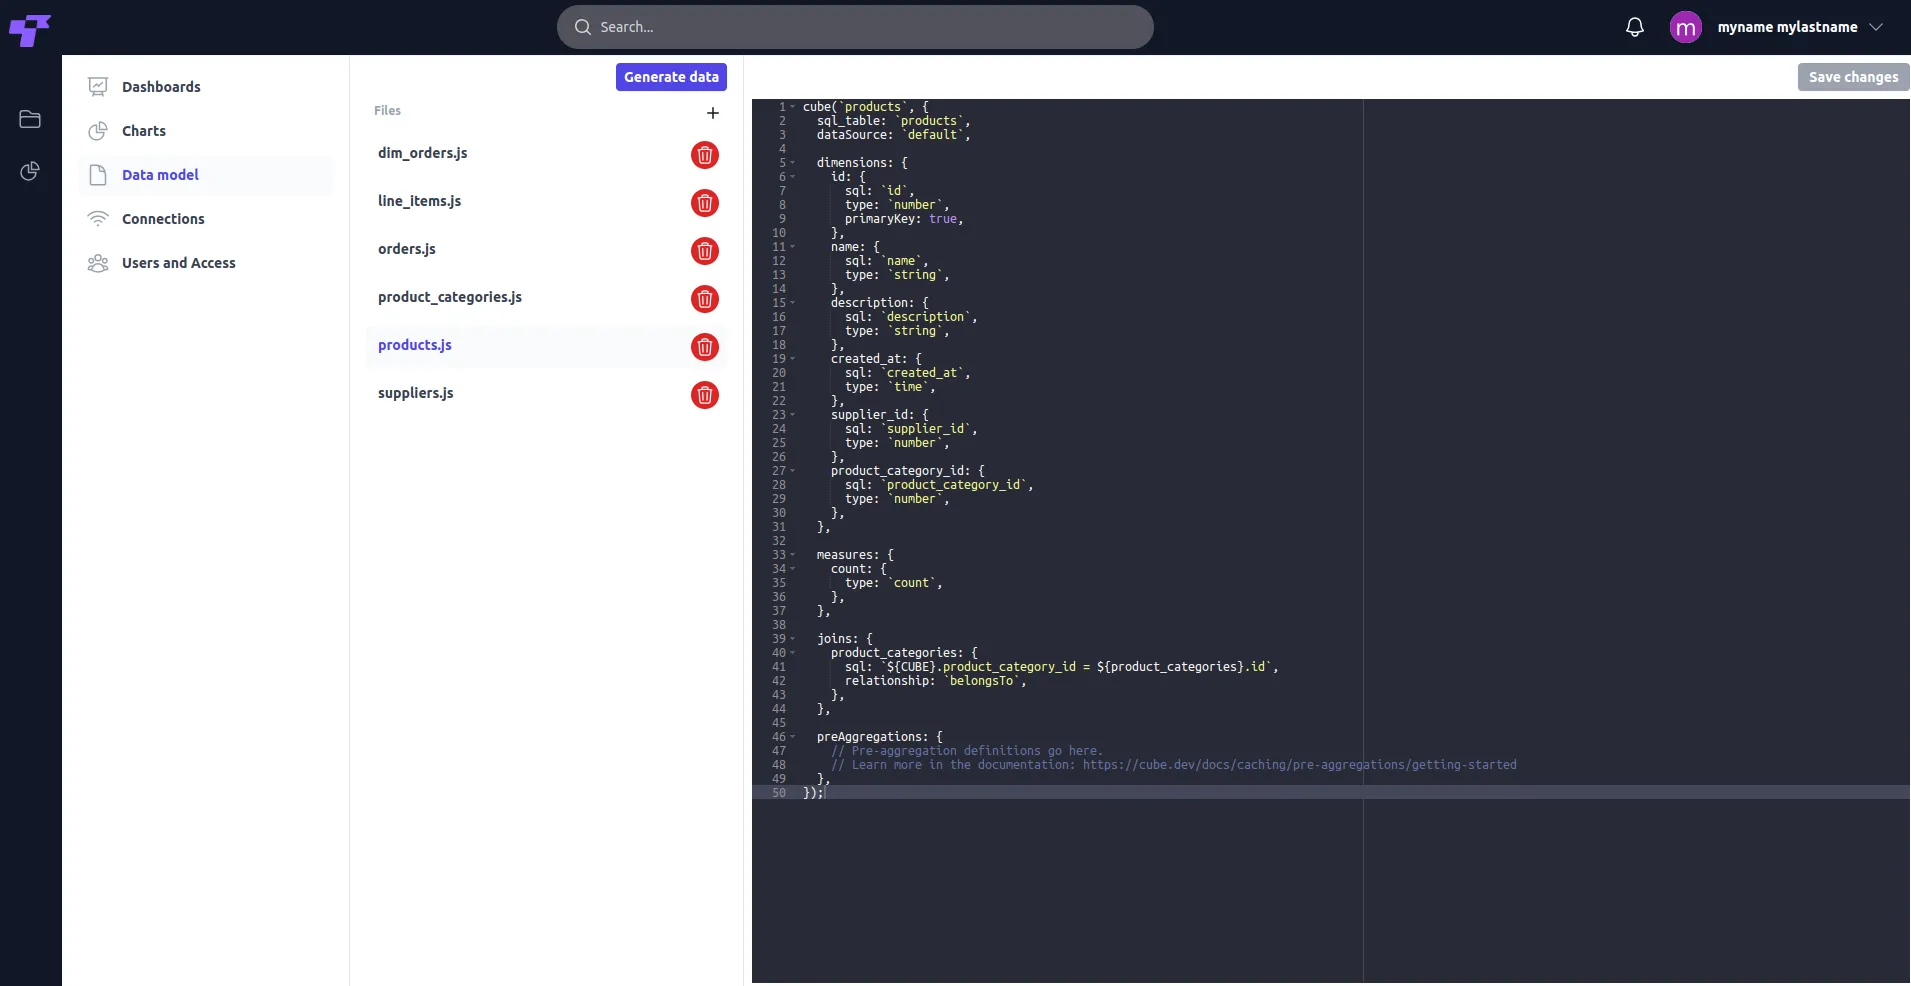
- Edit dimensions: Add or adjust fields like id, name, or created_at in your datasets.
- Create measures: Define calculations such as counts or sums.
- Establish joins: Link data across different entities, enabling seamless querying.
- Pre-aggregations: Optimize performance by defining pre-calculated datasets.
Don't forget to click "Save changes" on the top right when modifying code.
Charts
The Charts section allows users to manage, edit, and create visual representations of your data. From this interface, you can access existing charts and see their details, such as owner, creation date, and updates.
- Use the Edit (pencil icon) to modify an existing chart.
- Use Delete (trash icon) to remove it permanently.
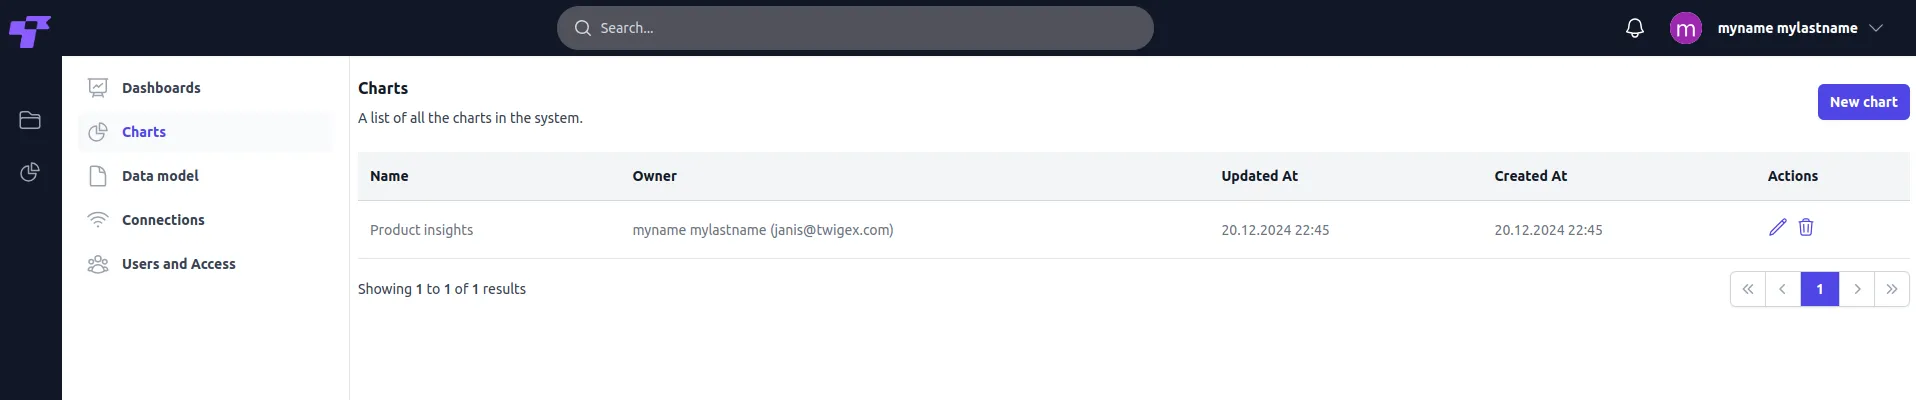
Creating a chart
Click New Chart in the top right to open the chart creation interface, where you can define chart properties and customize your visualization.
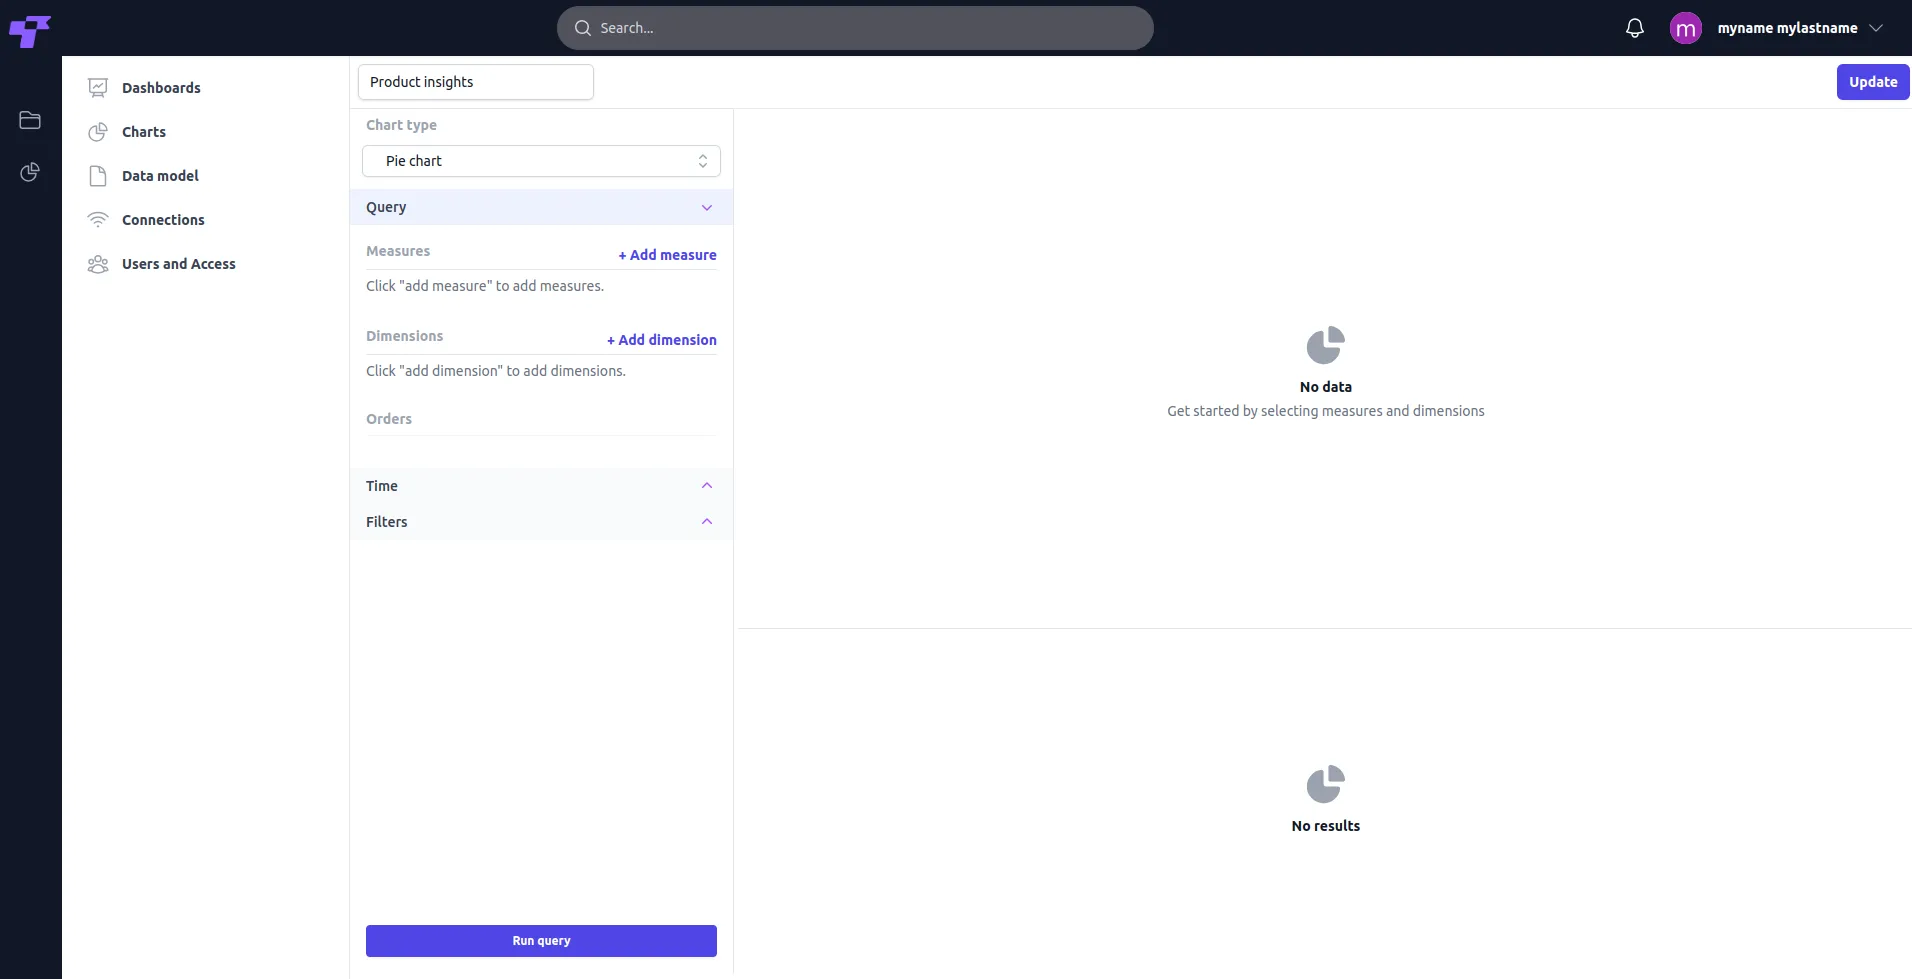
Editing chart name, type, and query
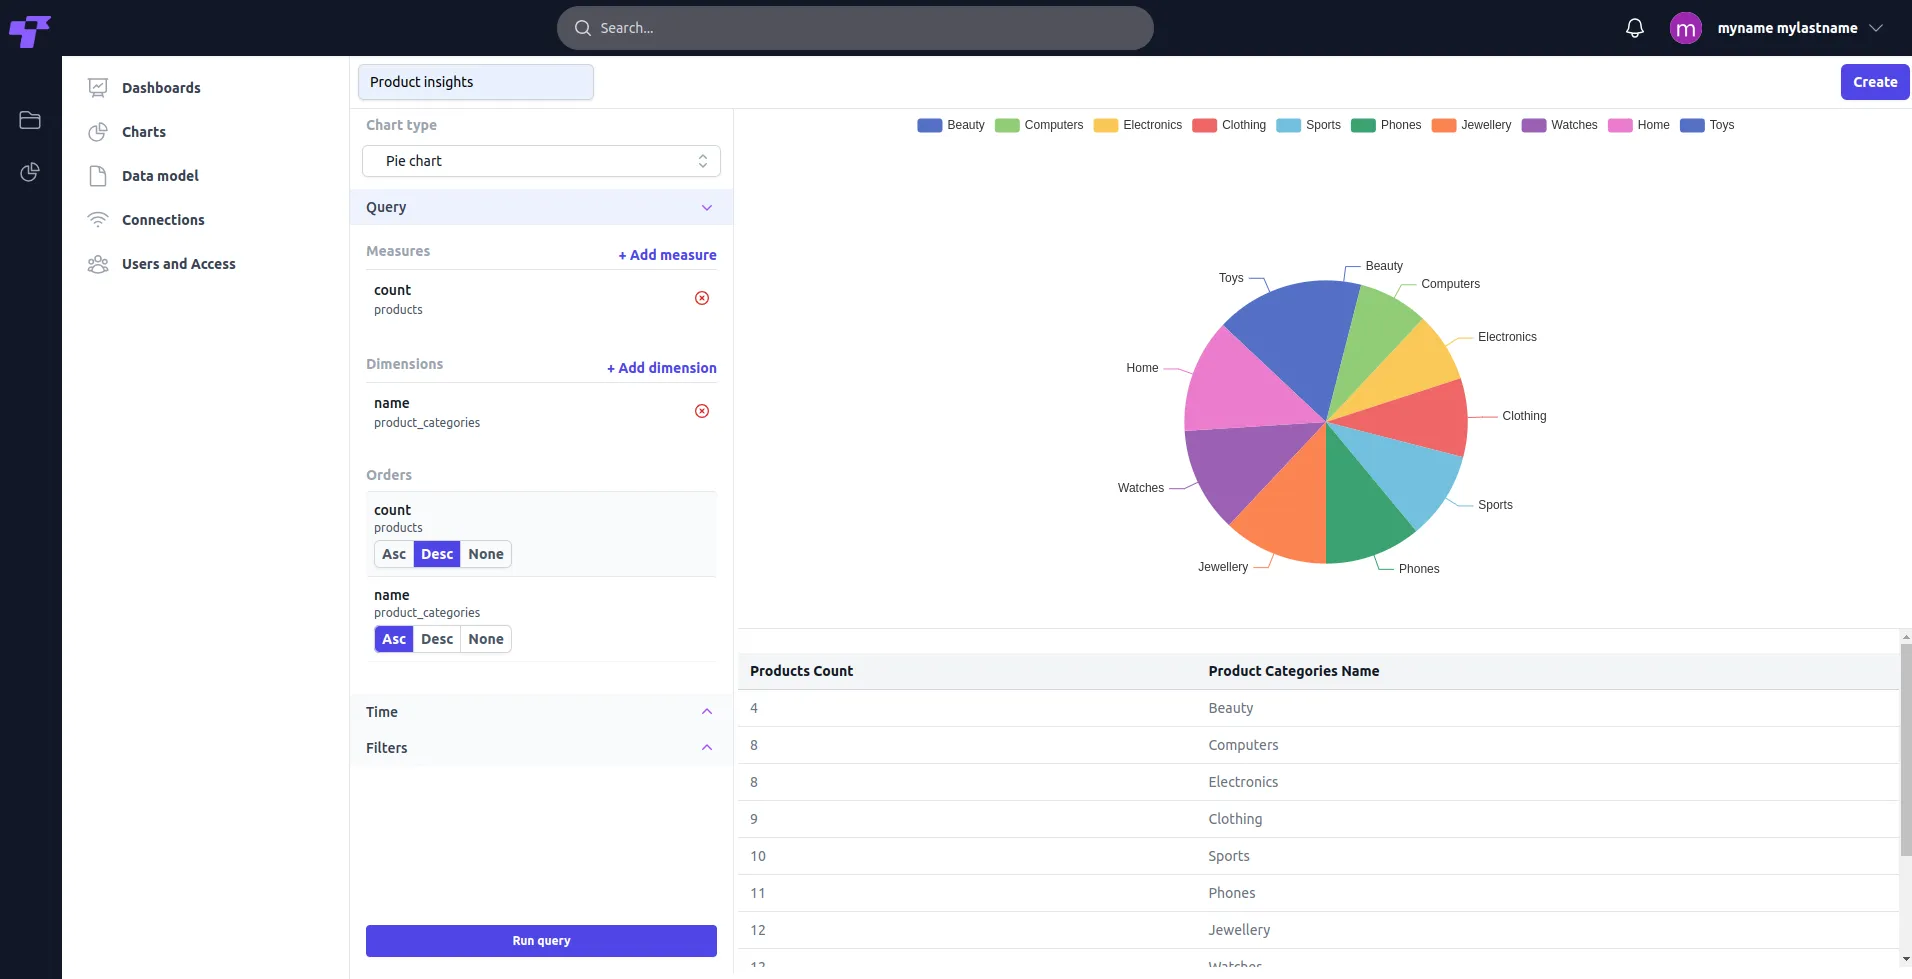
- Chart name: Enter a descriptive name for your chart in the "Chart Name" field (e.g., Product Insights).
- Chart type: Choose from a variety of chart types to best represent your data, such as Pie Chart, Bar Chart, Line Chart, Big Number, Path Map, or GeoJSON (Line).
- Measures and dimensions: Add measures to calculate key metrics (e.g., count of products) and dimensions to categorize data (e.g., product categories).
- Order and sorting: Adjust sorting for your measures and dimensions using Asc (Ascending), Desc (Descending), or None to modify the visualization layout.
Click the "Run Query" button to preview the chart based on your selected configurations. The generated visualization will appear on the right side of the screen.
To delete a selected item, simply press the red "X" icon next to it.
Time configuration in charts
The Time section provides users with the ability to analyze data trends over specific periods. It's a crucial feature for businesses analyzing historical performance or forecasting future trends.
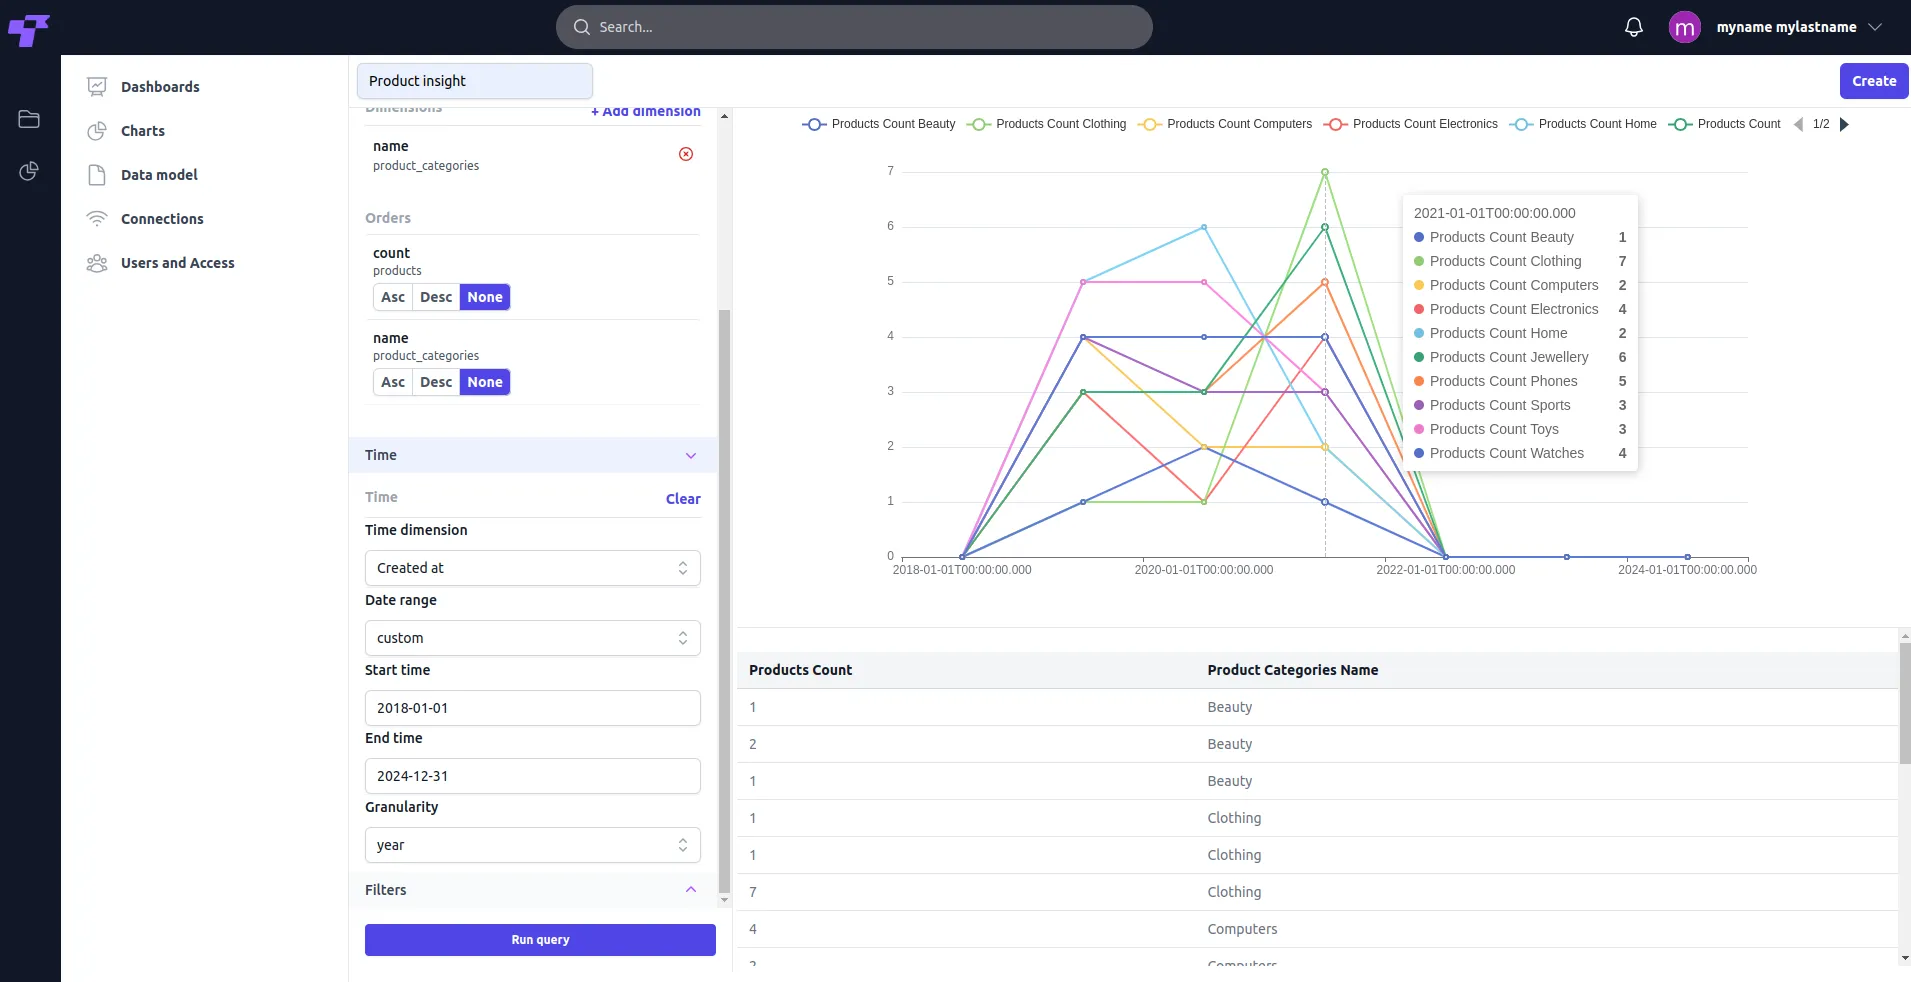
- Time dimension: Select a time field from your data (e.g., Created at in this example) to use as the primary time axis for your chart.
- Date range: Specify the desired time period to be displayed in your chart. Options include preset ranges such as "Today," "Last Month," "Custom," etc.
- Granularity: Determines how detailed the time breakdown is for your chart. Options include seconds, minutes, quarter, year, etc.
Click the "Run Query" button to preview the chart based on your selected configurations.
Filtering data
The filtering feature in the Charts section enables users to refine their data queries by setting specific conditions. This is useful for narrowing down results to meet specific analysis needs.
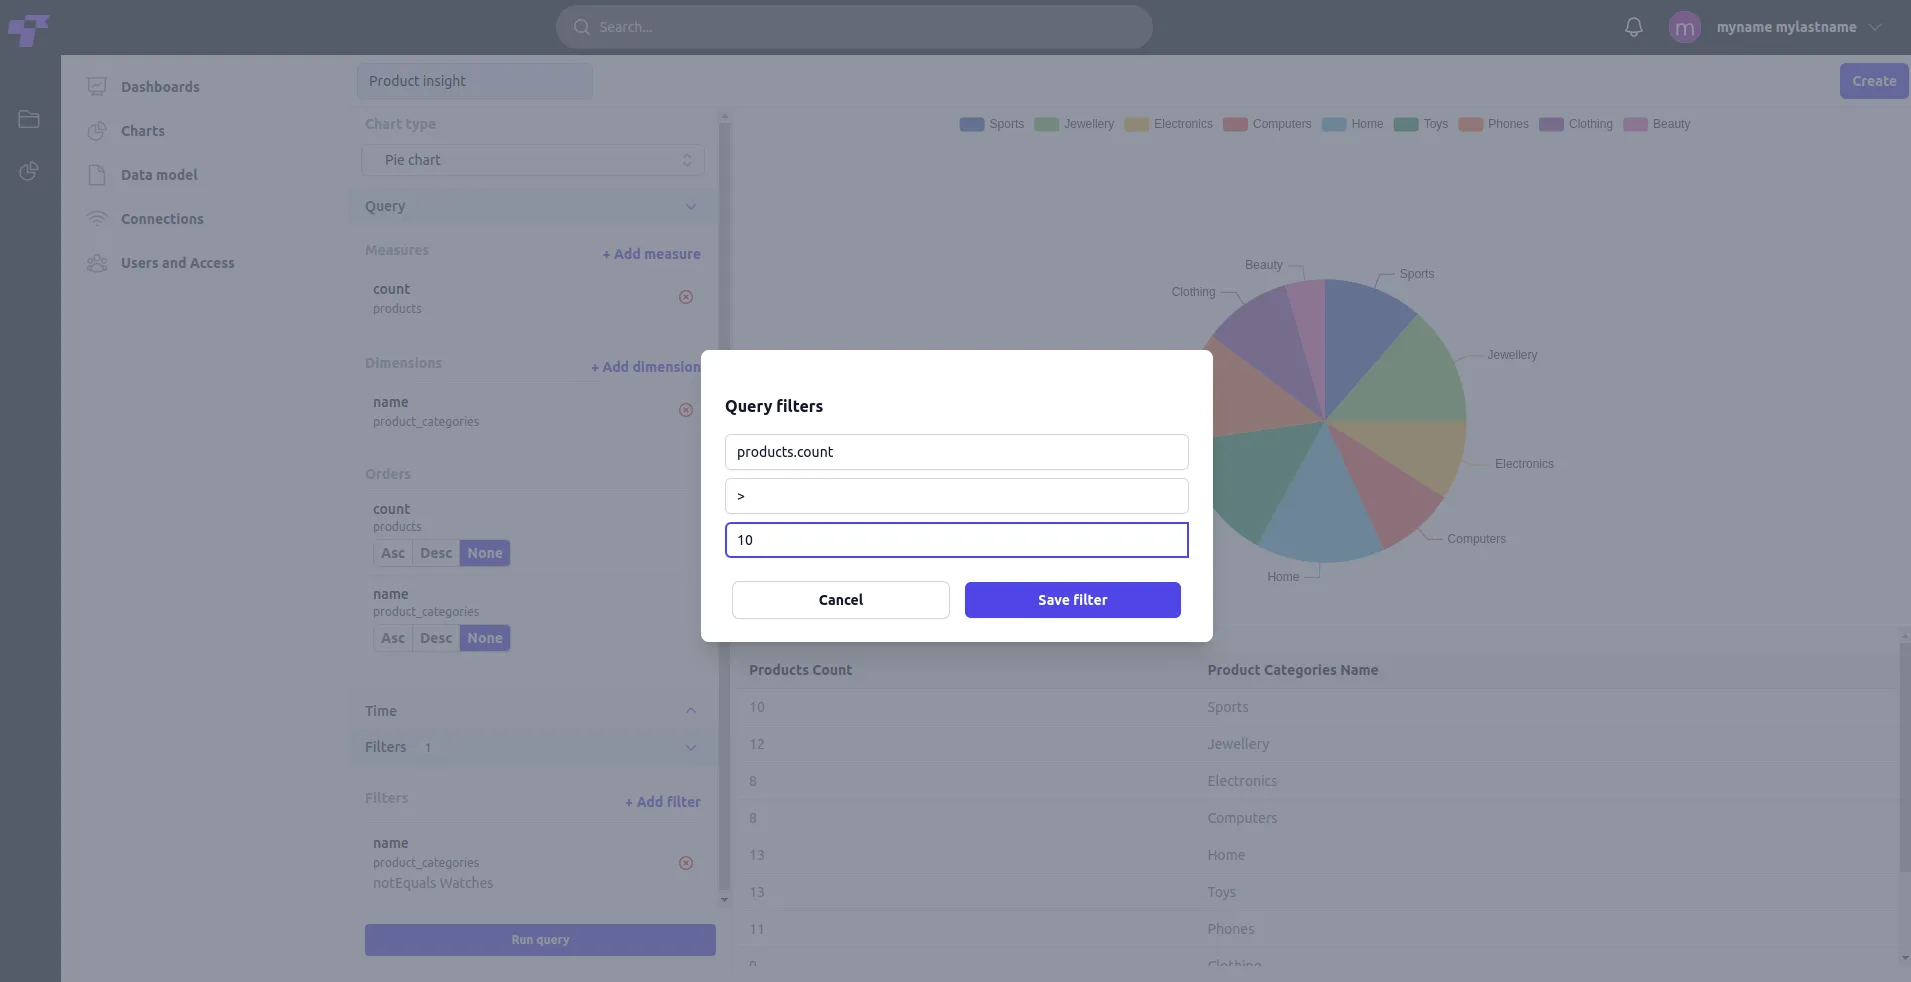
In the left-hand query panel, find the Filters section.
- Click + Add filter to open the Query filters popup.
- Define the filter criteria:
- Select member: Choose the data field (dimension or measure) you want to filter.
- Select operator: Choose a condition (e.g., equals, notEquals, greater than, less than, etc.).
- Enter value: Specify the value for the selected condition.
- Click Save filter to apply it.
Example: Member: products.count, Operator: > (greater than), Value: 10
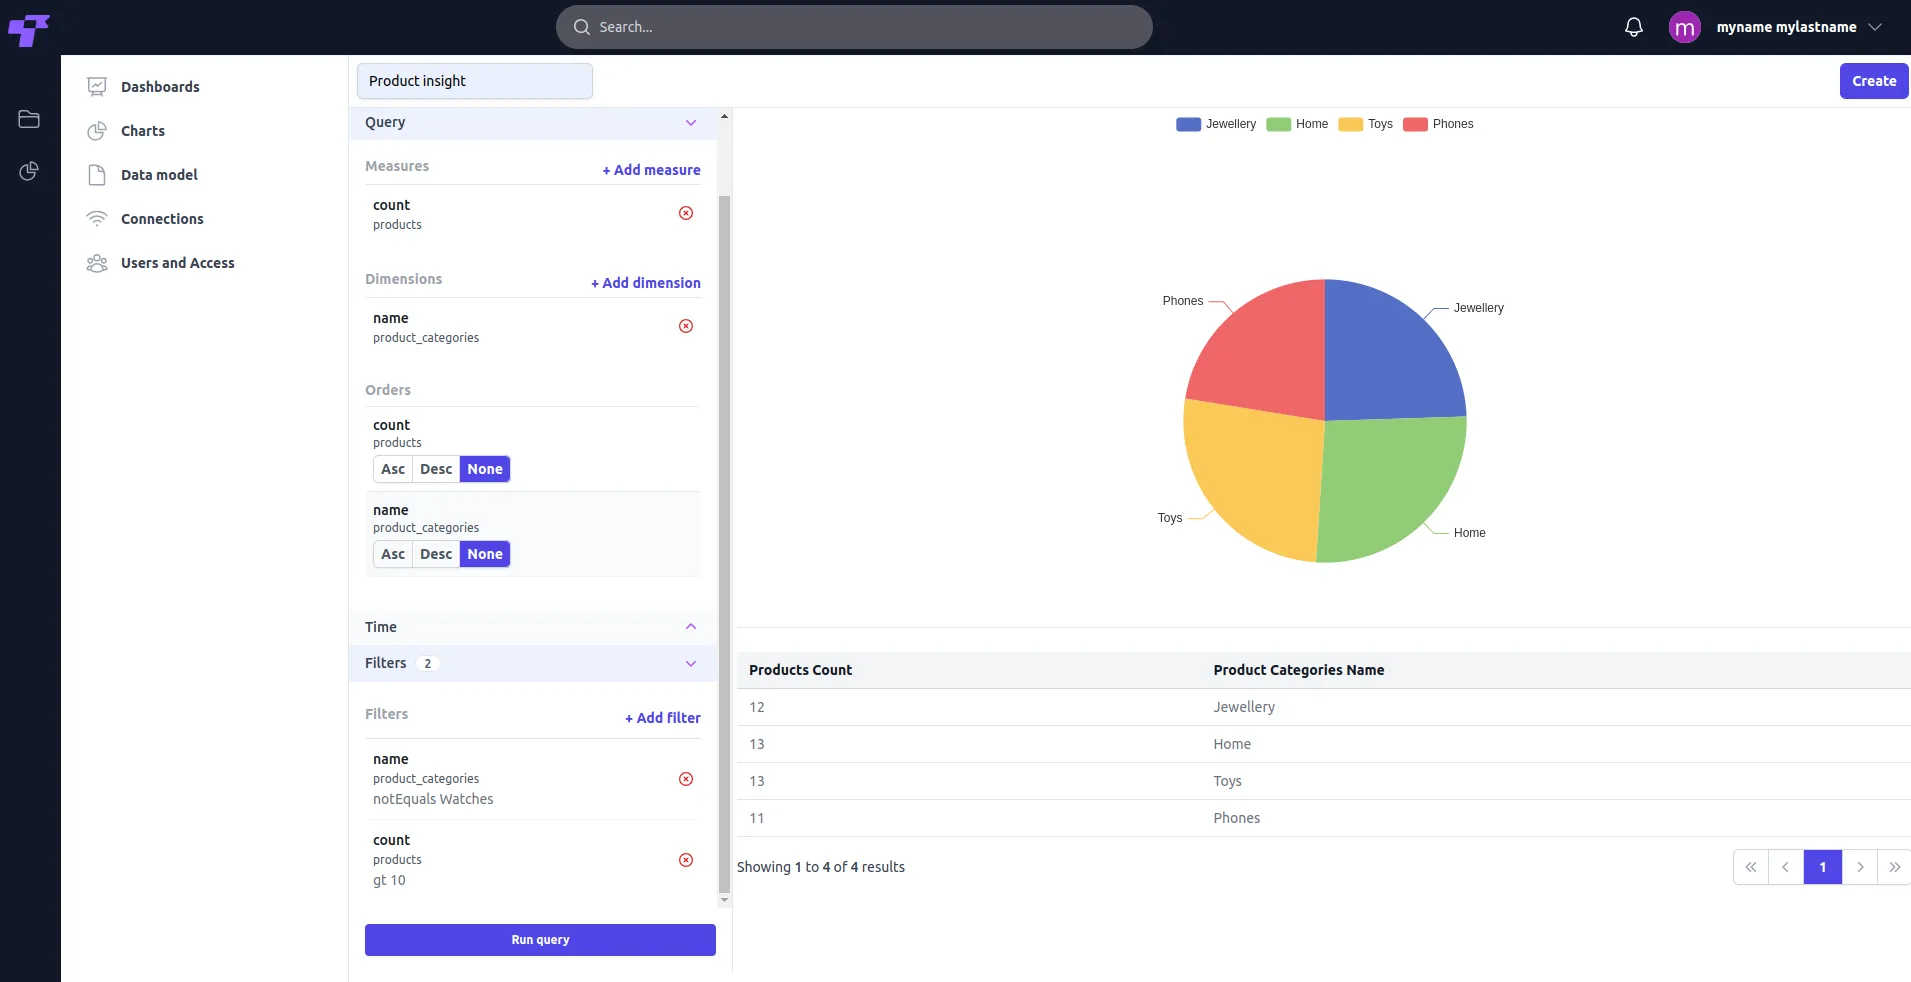
- Multiple filters can be combined for complex queries.
- To delete an existing filter, click the red X next to the filter in the Filters section.
Click the Create button in the top-right corner to save the chart and add it to the charts list.
Dashboards
The Dashboard List View displays all the created dashboards in the system, providing an organized summary for easy access and management. The Dashboard section serves as the central hub for organizing and presenting multiple charts and visualizations in one place.
- Title: The name of the dashboard (e.g., "Product Performance Overview").
- Description: A brief summary of the dashboard's purpose (e.g., "product trends and performance").
- Owner: Indicates the creator of the dashboard, along with their email address.
- Timestamps: Displays the "Created At" and "Updated At" timestamps to track dashboard changes.
To open a dashboard, click on its title.

Creating a dashboard
- Click New Dashboard in the top right to create a new dashboard.
- Add a dashboard title and description (optional).
- Click the Create button to finalize and save your dashboard.
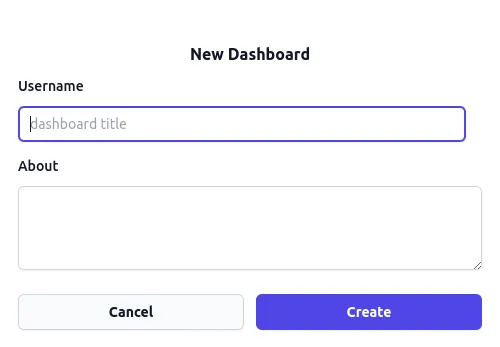
Once created, the new dashboard will appear in the Dashboard List View, ready to have charts and filters added.
Editing a dashboard
This is the starting point for a newly created dashboard, which currently has no charts added.
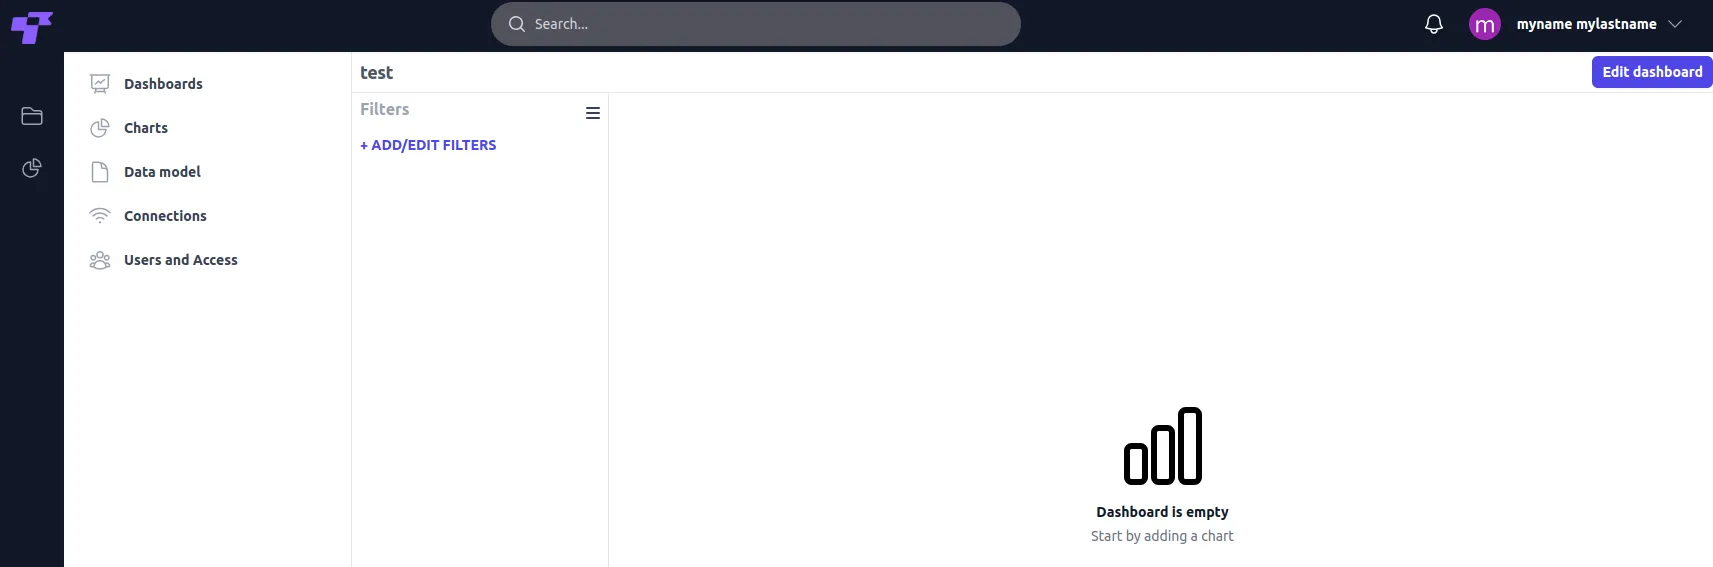
Adding charts to your view
- Click the Edit Dashboard button, located at the top-right corner.
- Add or remove charts from your charts list on the right.
- Resize charts: Use the drag-and-drop functionality to adjust the size of each chart. Drag the edges of a chart to make it as big or as wide as you want.
Save Changes: After adding or removing charts, click the Save Changes button to apply and save your updates.
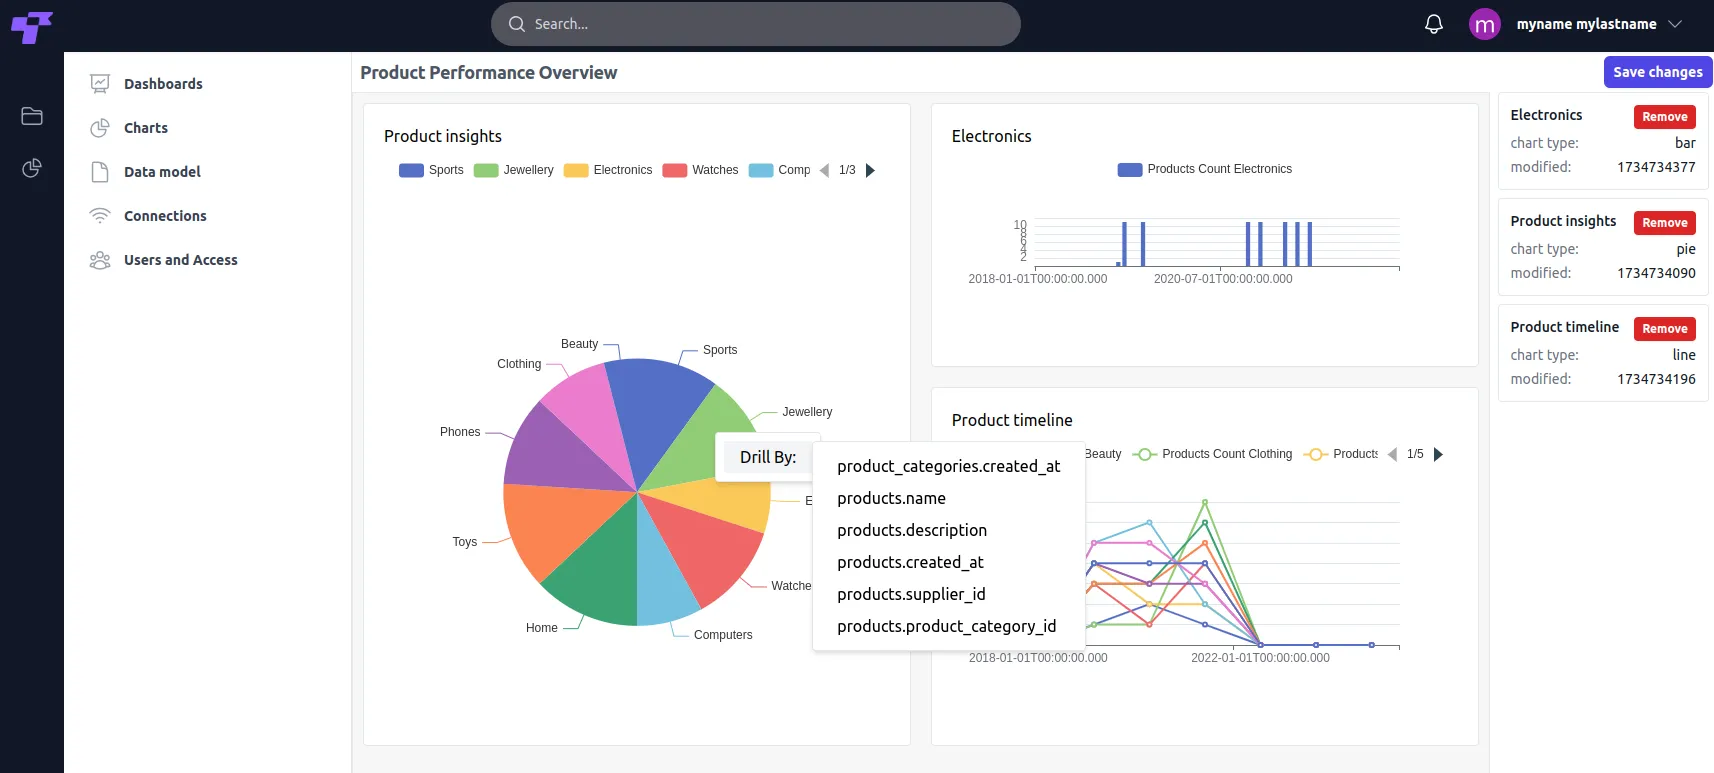
Using the drill-down feature
- Interactive exploration: Click on chart elements, such as specific bars or pie slices, to reveal more granular data related to that item.
- Dynamic updates: The dashboard adjusts automatically, showing detailed breakdowns or related metrics for the selected item.
- Enhanced insights: Quickly dive deeper into your data to identify trends, anomalies, or specific details without navigating away.
Filtering dashboards
The filtering feature in dashboards allows users to refine the data displayed on charts based on specific criteria.
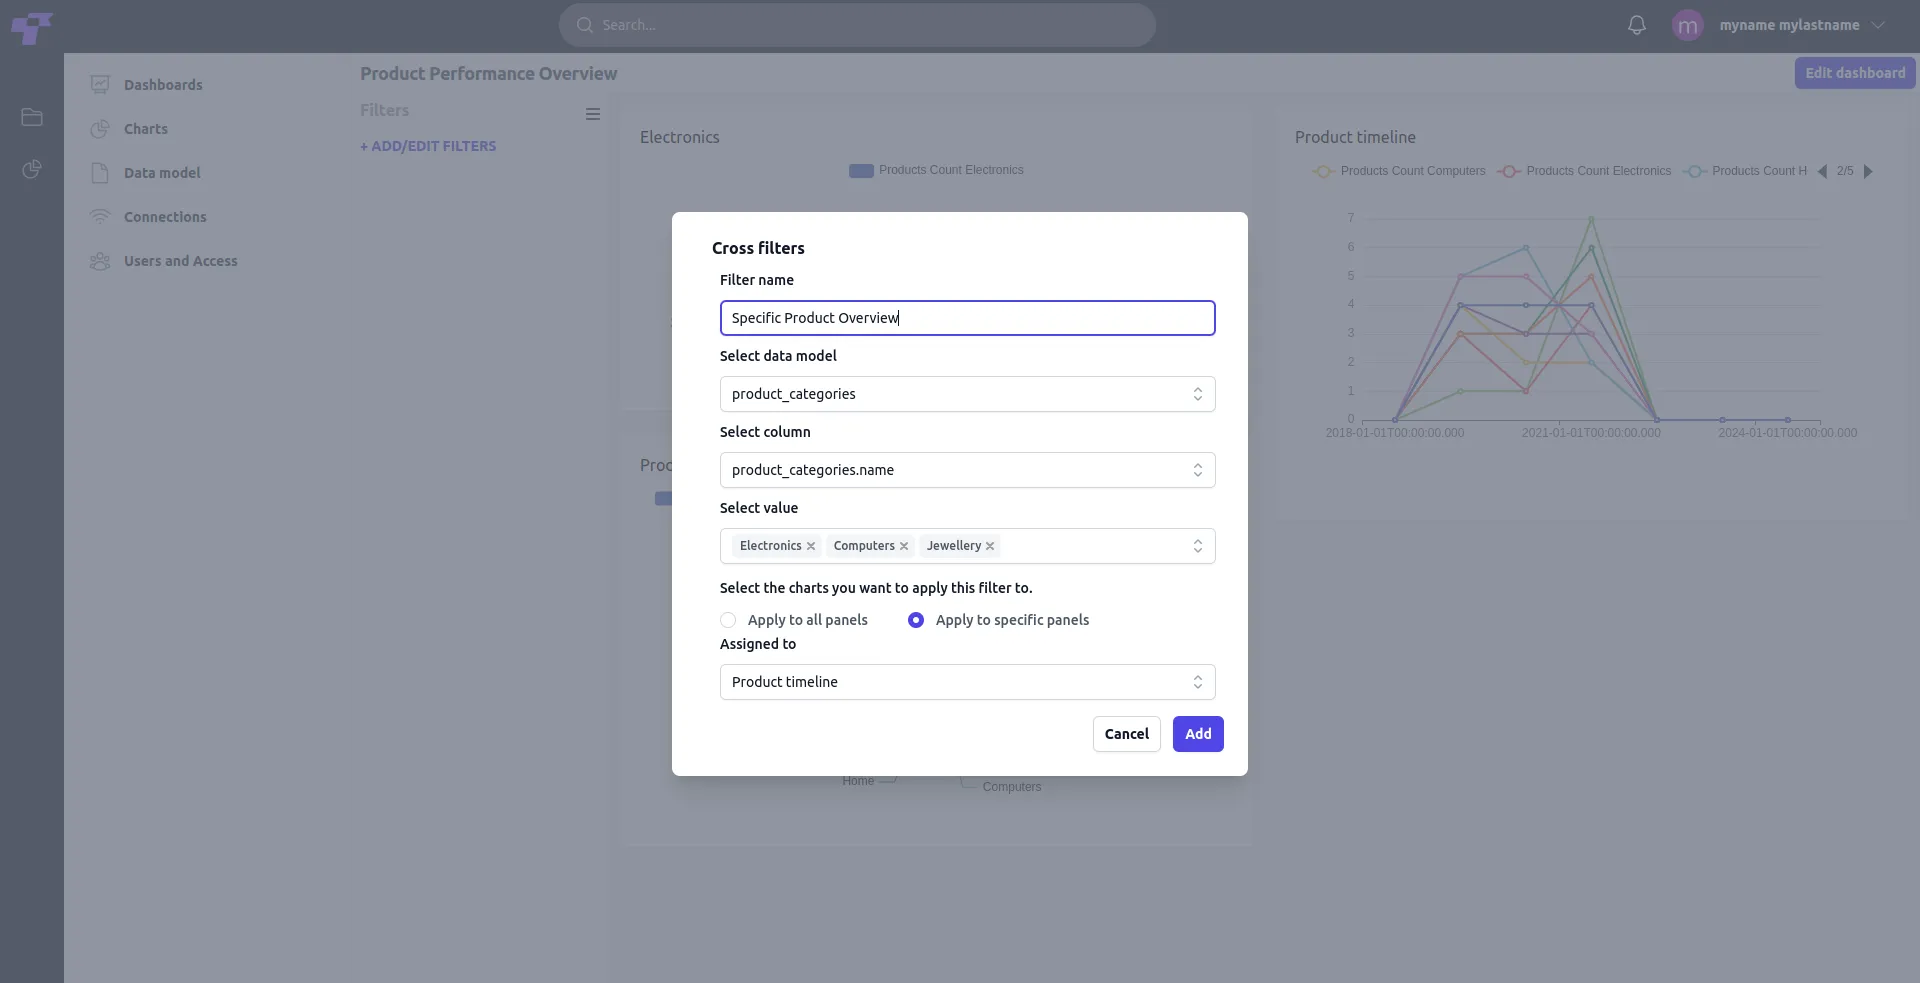
Accessing the filters panel
- Navigate to the "Filters" section in your dashboard.
- Click + ADD/EDIT FILTERS to open the filter creation modal.
Defining your filter
- Filter name: Provide a unique name for the filter to easily identify it. In this example, the filter is named Specific Product Overview.
- Select data model: Choose the data model that contains the data you want to filter. For example, select product_categories.
- Select column: Pick the column you want to filter by. In this case, it is product_categories.name.
- Select values: Add the values you want to filter. For instance, you can choose Electronics, Computers, and Jewellery.
- Assign the filter to charts: Apply the filter to every chart on the dashboard for a universal effect, or to particular charts. In this example, the filter is applied to the Product timeline chart.
After configuring the filter, click Add to save and apply the filter to the selected panels.
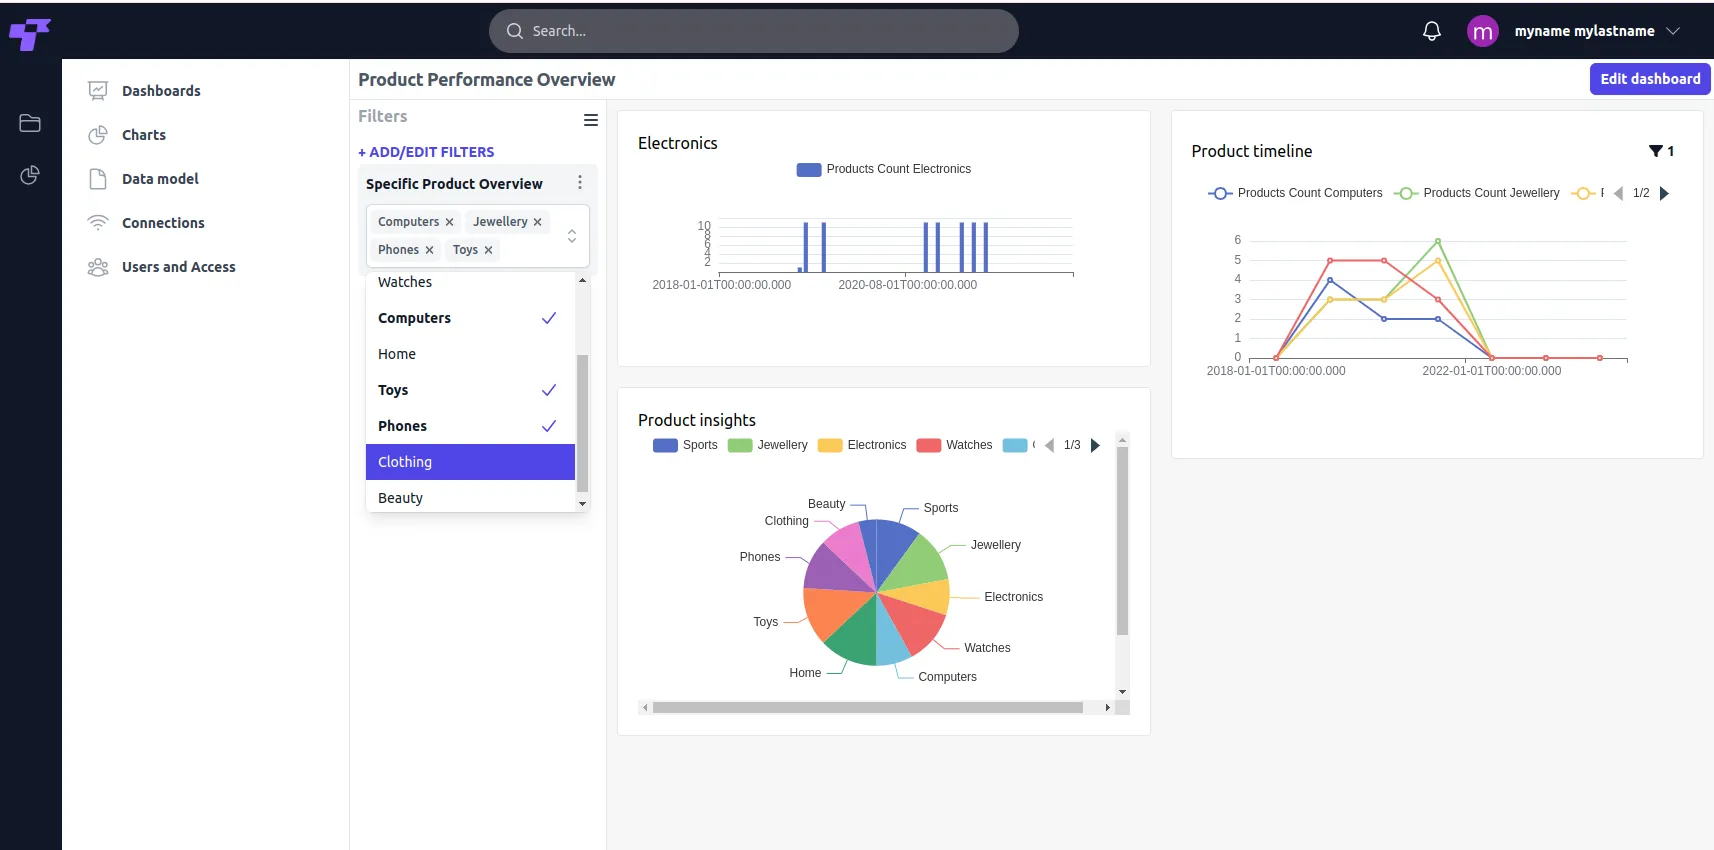
Dashboard interface
- Three dots (⋮): Located next to each filter name, this allows users to edit or delete specific filters directly.
- Horizontal lines icon: Acts as a toggle to slide the Filters menu in and out.
- Filters icon: Located next to a chart's top right, indicates how many and which filters are applied.
- Filter dropdown: Allows you to quickly add or remove categories by checking or unchecking the relevant items.
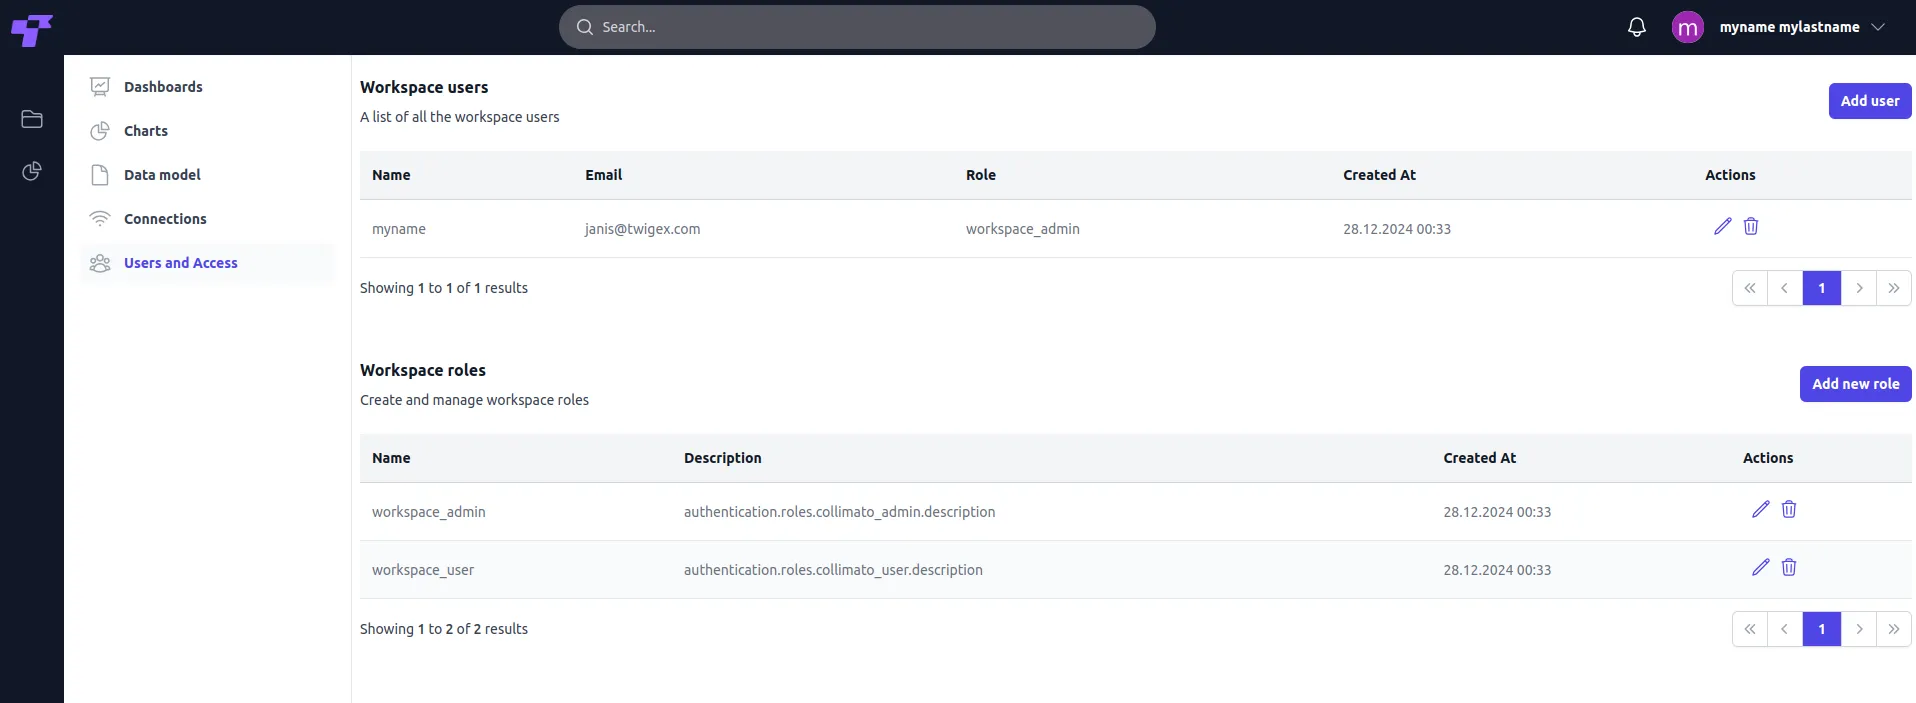
Users and access
- Users: Manage users and their roles within your workspace.
- Roles: Administrators can define roles with specific permissions and restrictions. This allows tailored access control for different user roles, ensuring that each user can only perform actions relevant to their responsibilities.
By assigning precise permissions to roles, you can streamline workflows and prevent unauthorized access to sensitive data or system functionalities.
- Pencil icon (edit button): Change the assigned role of a user or edit role preferences.
- Trash icon (delete button): All of the user's data will be deleted in the created workspace.
Adding a new user
- Click the Add user button in the top right corner. This will open the Add User to Workspace dialog.
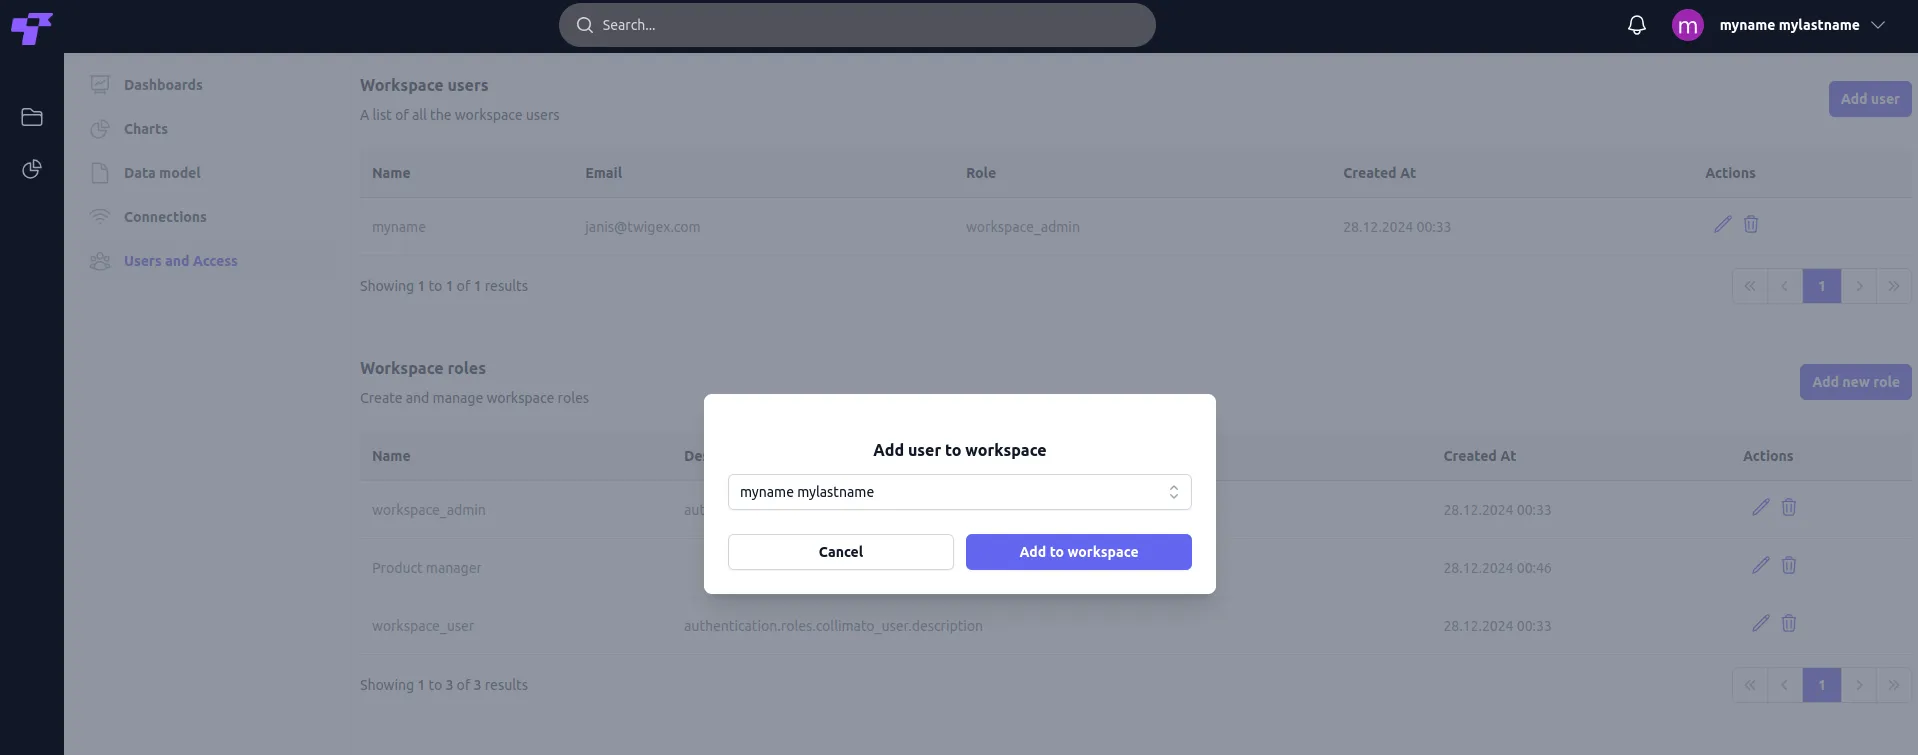
- Fill in user details: From the dropdown menu of all Twigex users, choose the people related to this workspace project.
- Click the Add to Workspace button to save the user's details and add them to this specific workspace.
- Assign a role to a user by clicking the pencil icon (edit button) next to their name in the user list. You can select one or more roles for the user as needed.
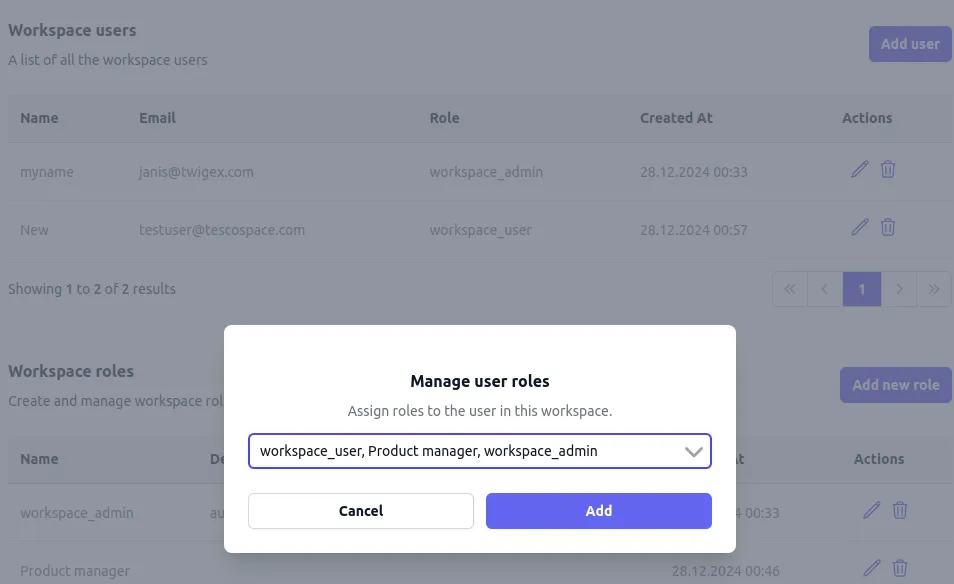
- Click Add to save changes.
Note that users added through this process are assigned only to the current workspace, not across all workspaces in the system.
Adding a new role
- Click the Add New Role button, located on the workspace user and access role list.
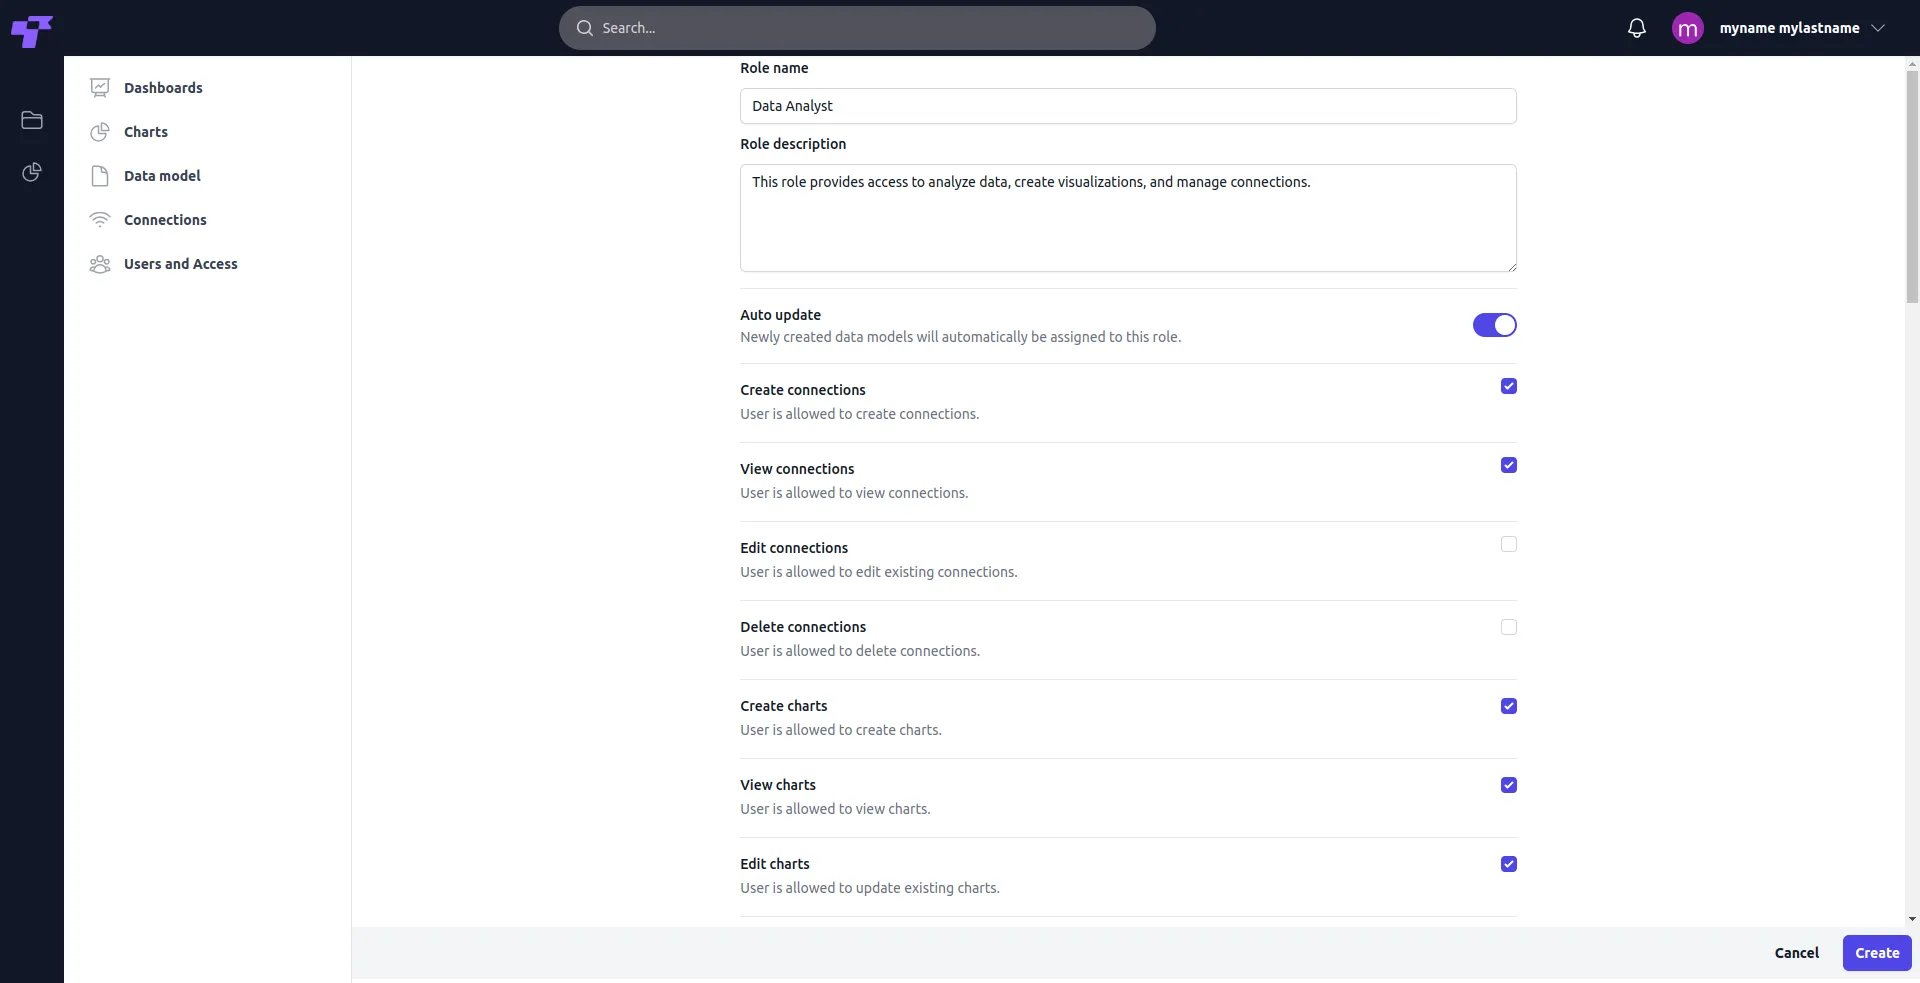
- Fill in the role name: A clear identifier for the role (e.g., "Data Analyst" or "Project Manager").
- Role description: Briefly describe the responsibilities associated with the role.
Don't forget to press the "Create" button at the bottom right of the screen to save all changes.
Once created, the role will appear in the User Roles list under the Users and Access section, where it can be managed and updated as needed.
Permissions
There's a comprehensive list of permissions covering various functionalities like managing connections, charts, dashboards, roles, and data models. Administrators can toggle these permissions on or off depending on what each user or role needs to access or modify.
General permissions

Auto update: Newly created data models are automatically assigned to this role. Example: Automatically granting analysts access to all new sales data models ensures they don't miss critical updates.
Connection management
Permissions related to creating, viewing, editing, or deleting data connections.
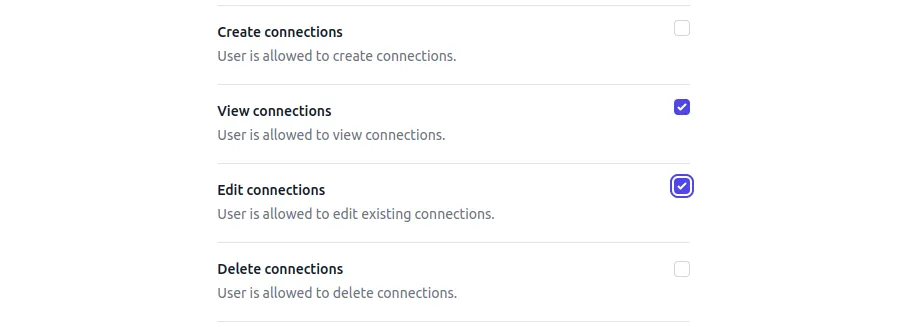
- Create connections: Users can connect new databases or data sources. Example: A database manager connects a new supplier database for future analysis.
- View connections: Users can view the existing connections. Example: A team lead reviews available data sources before assigning tasks.
- Edit connections: Users can update connection details. Example: Correcting database login credentials after a password change.
- Delete connections: Users can remove old or unused connections. Example: Disconnecting outdated data sources to improve system efficiency.
Chart management
These permissions control how users interact with visualizations, including creating, editing, or deleting charts.
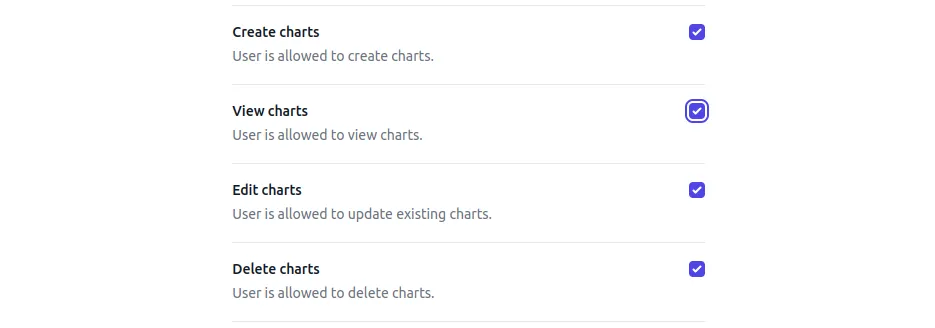
- Create charts: Users can design visual representations of data. Example: A marketing analyst creates a chart to compare campaign performance.
- View charts: Users can access and analyze existing charts. Example: A manager reviews team productivity through pre-made visual reports.
- Edit charts: Users can modify existing charts. Example: Updating a chart with additional filters to narrow down specific data.
- Delete charts: Users can remove outdated or unnecessary charts. Example: Deleting duplicate charts created during testing.
User and role management
Permissions to manage workspace users and their roles, defining who can access specific features and data.
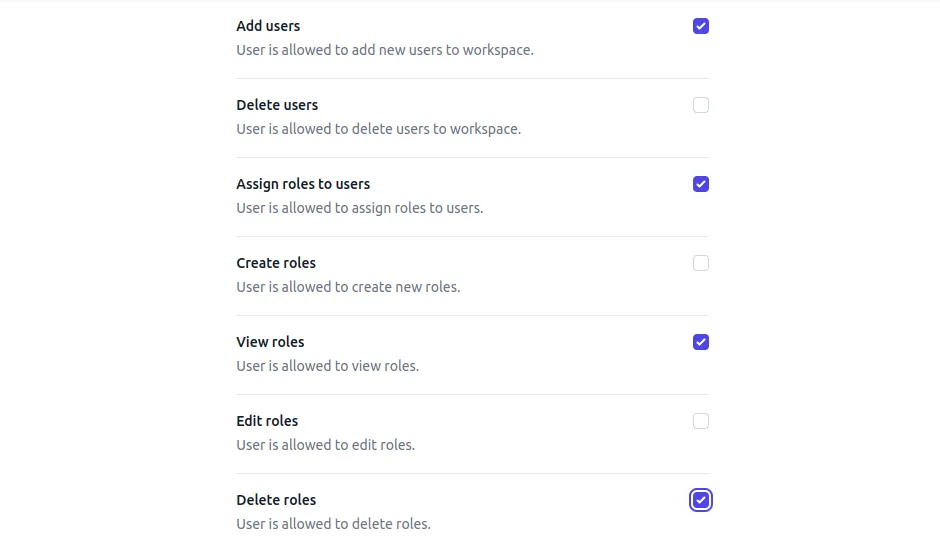
- Add users: Users can invite new members to the workspace. Example: Onboarding a new team member into the project workspace.
- Delete users: Users can remove access for members. Example: Revoking access for a contractor whose project is completed.
- Assign roles to users: Users can allocate or update roles for others. Example: Assigning the "Editor" role to a team member for content approval.
- Create roles: Users can define new roles with customized permissions. Example: Creating a "Sales Representative" role with access to only specific charts and dashboards.
- View roles: Users can review existing role configurations. Example: A manager checks what permissions a "Data Analyst" role includes.
- Edit roles: Users can update roles by adding or removing permissions. Example: Granting "Dashboard Editing" rights to project managers.
- Delete roles: Users can remove redundant roles. Example: Deleting old roles no longer in use.
Data models
Permissions for creating, viewing, editing, or deleting data models, which form the foundation of data queries and analytics.
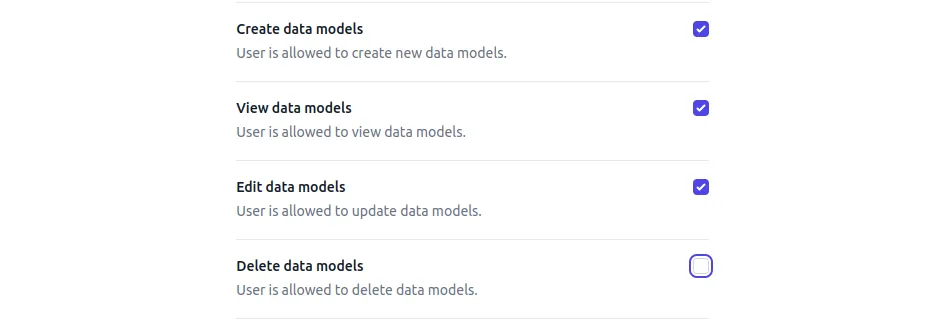
- Create data models: Users can create new models from database connections. Example: Setting up a data model for customer transaction analysis.
- View data models: Users can view and understand the structure of existing models. Example: A team member checks the schema of the sales data model.
- Edit data models: Users can update or add fields to data models. Example: Adding a new metric to the revenue data model.
- Delete data models: Users can remove unnecessary models. Example: Cleaning up old test data models to declutter the workspace.
Dashboard management
Permissions to build, view, edit, or delete dashboards, which aggregate multiple charts and data insights.
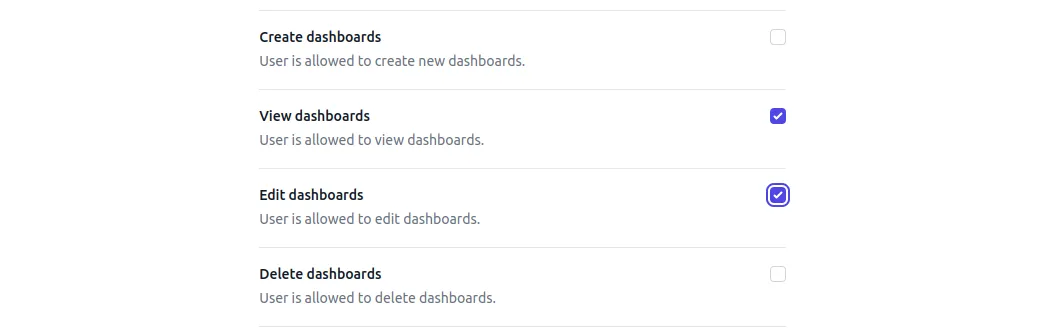
- Create dashboards: Users can design new dashboards for team use. Example: A finance team builds a dashboard to track monthly expenses.
- View dashboards: Users can access and analyze dashboards. Example: A CEO views the sales performance dashboard during a board meeting.
- Edit dashboards: Users can modify existing dashboards to meet updated requirements. Example: Adding new charts to the revenue overview dashboard.
- Delete dashboards: Users can remove dashboards that are no longer useful. Example: Deleting dashboards for completed projects.
Dashboard filters
Permissions to create, modify, or remove filters applied to dashboards.
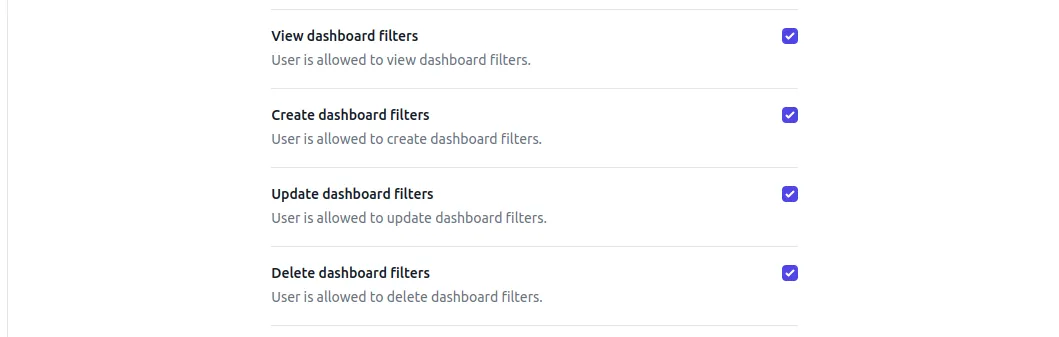
- View dashboard filters: Users can review filters applied to dashboards. Example: Checking the active filters on a sales dashboard to understand the data scope.
- Create dashboard filters: Users can define new filters for dashboards. Example: Adding a region filter to view sales data for specific locations.
- Update dashboard filters: Users can adjust existing filters. Example: Changing the time range filter to include the latest quarter.
- Delete dashboard filters: Users can remove unwanted filters from dashboards. Example: Cleaning up filters that are no longer relevant.
Data model permissions
By default, roles have no permissions to access any data model. Administrators can define specific data model permissions to control which datasets users can interact with. This section allows adding or removing data models accessible to the role.

- Click Add Data Permission to grant access to a new data model for the selected role (e.g., allowing the products or product_categories data model to be accessible to a sales team for analysis).
- To remove permissions, click the trash icon next to the data model you want to revoke access for.
Column and row restrictions
Define which columns of a data model a user or role cannot access. This ensures sensitive information, such as personal identifiers or financial data, remains protected from unauthorized users.
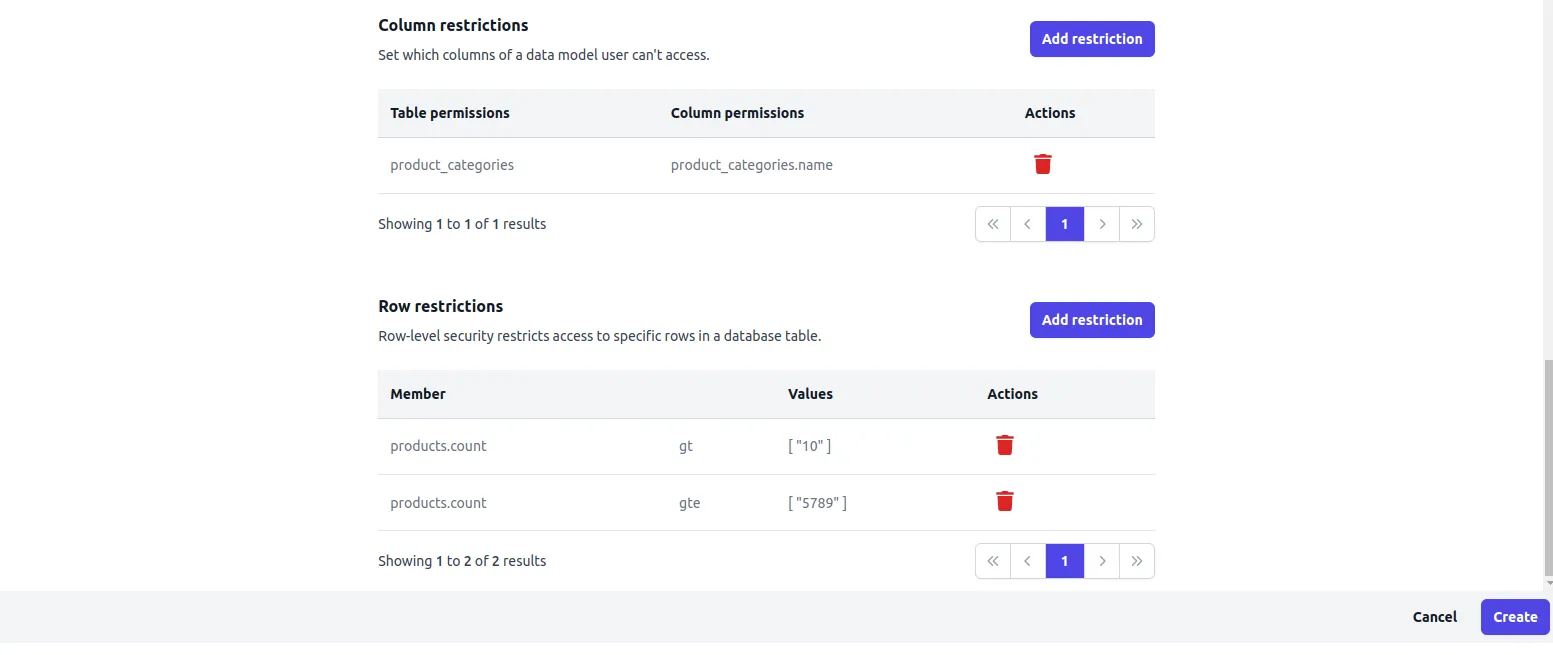
Click the Delete (trash) icon to remove the restriction if needed.
Column restriction
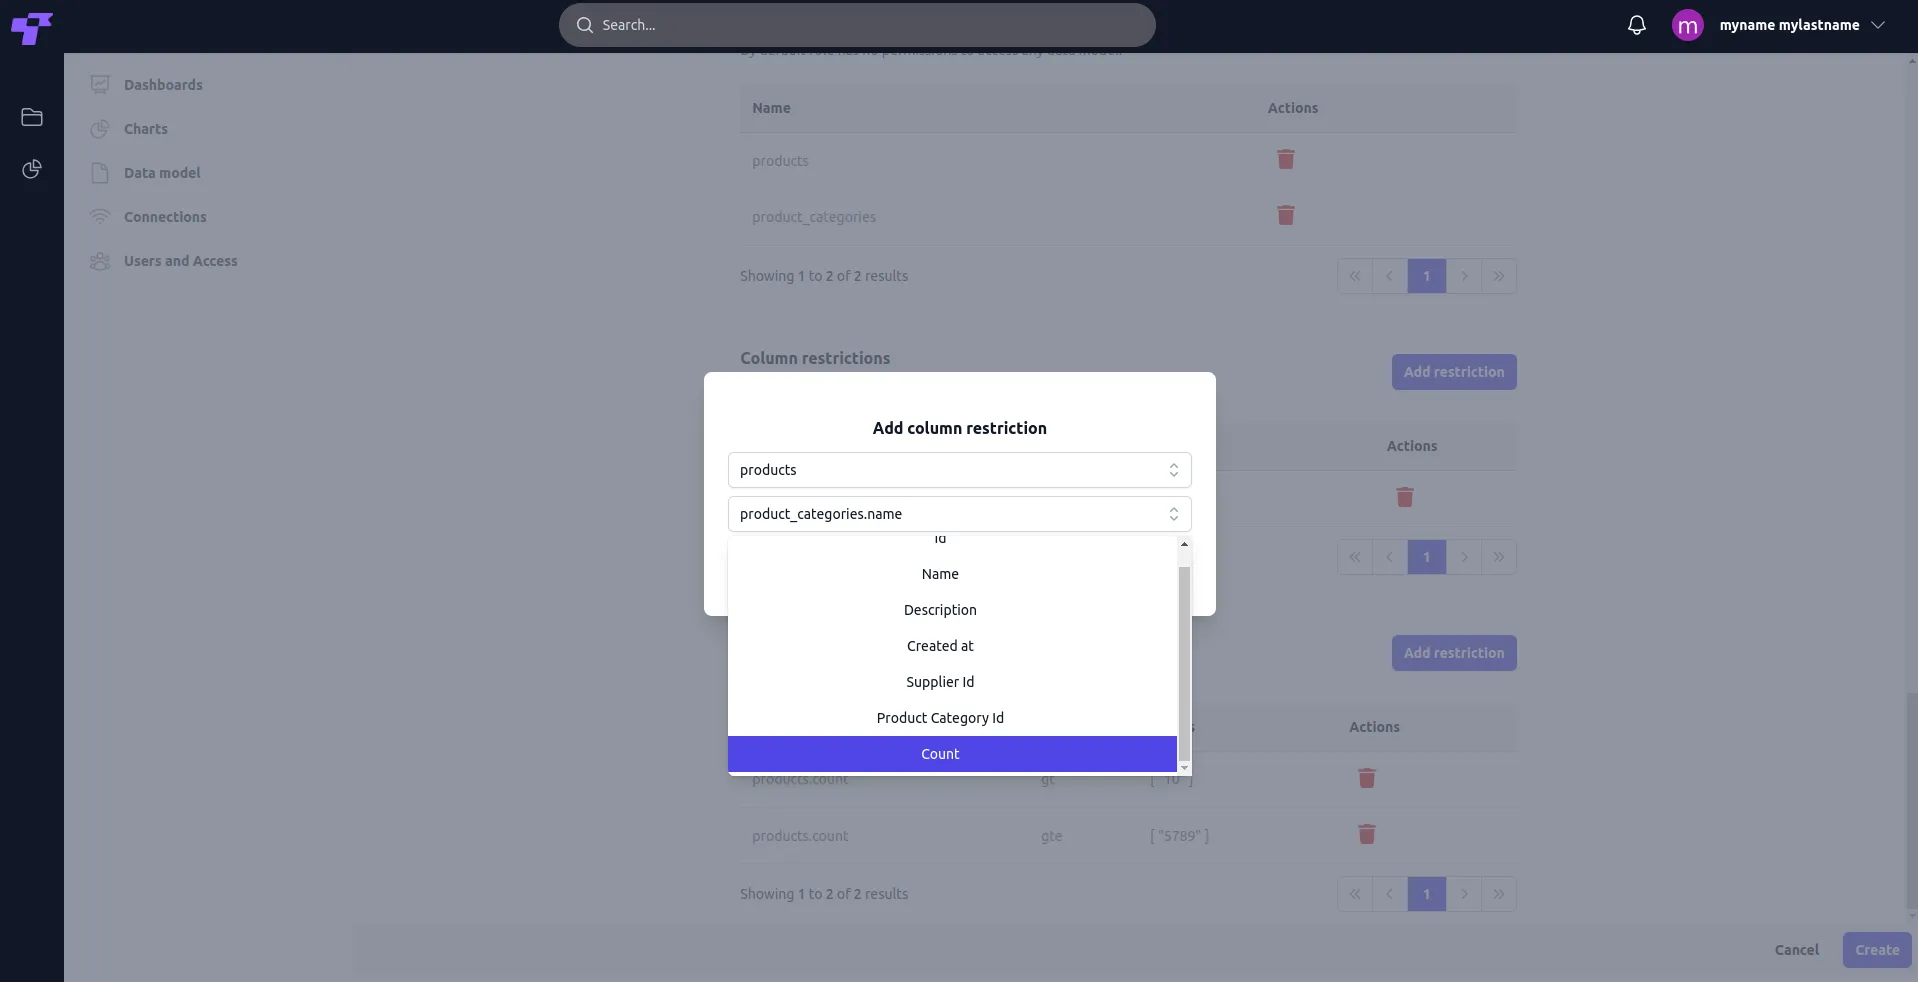
- Select table: The first dropdown allows users to choose a table (data model) where the restriction will be applied.
- Select column: Choose the specific column to restrict access from the second dropdown.
- Add restriction: Clicking this button applies the restriction and ensures the selected column is not accessible to users under the defined role.
Row restriction
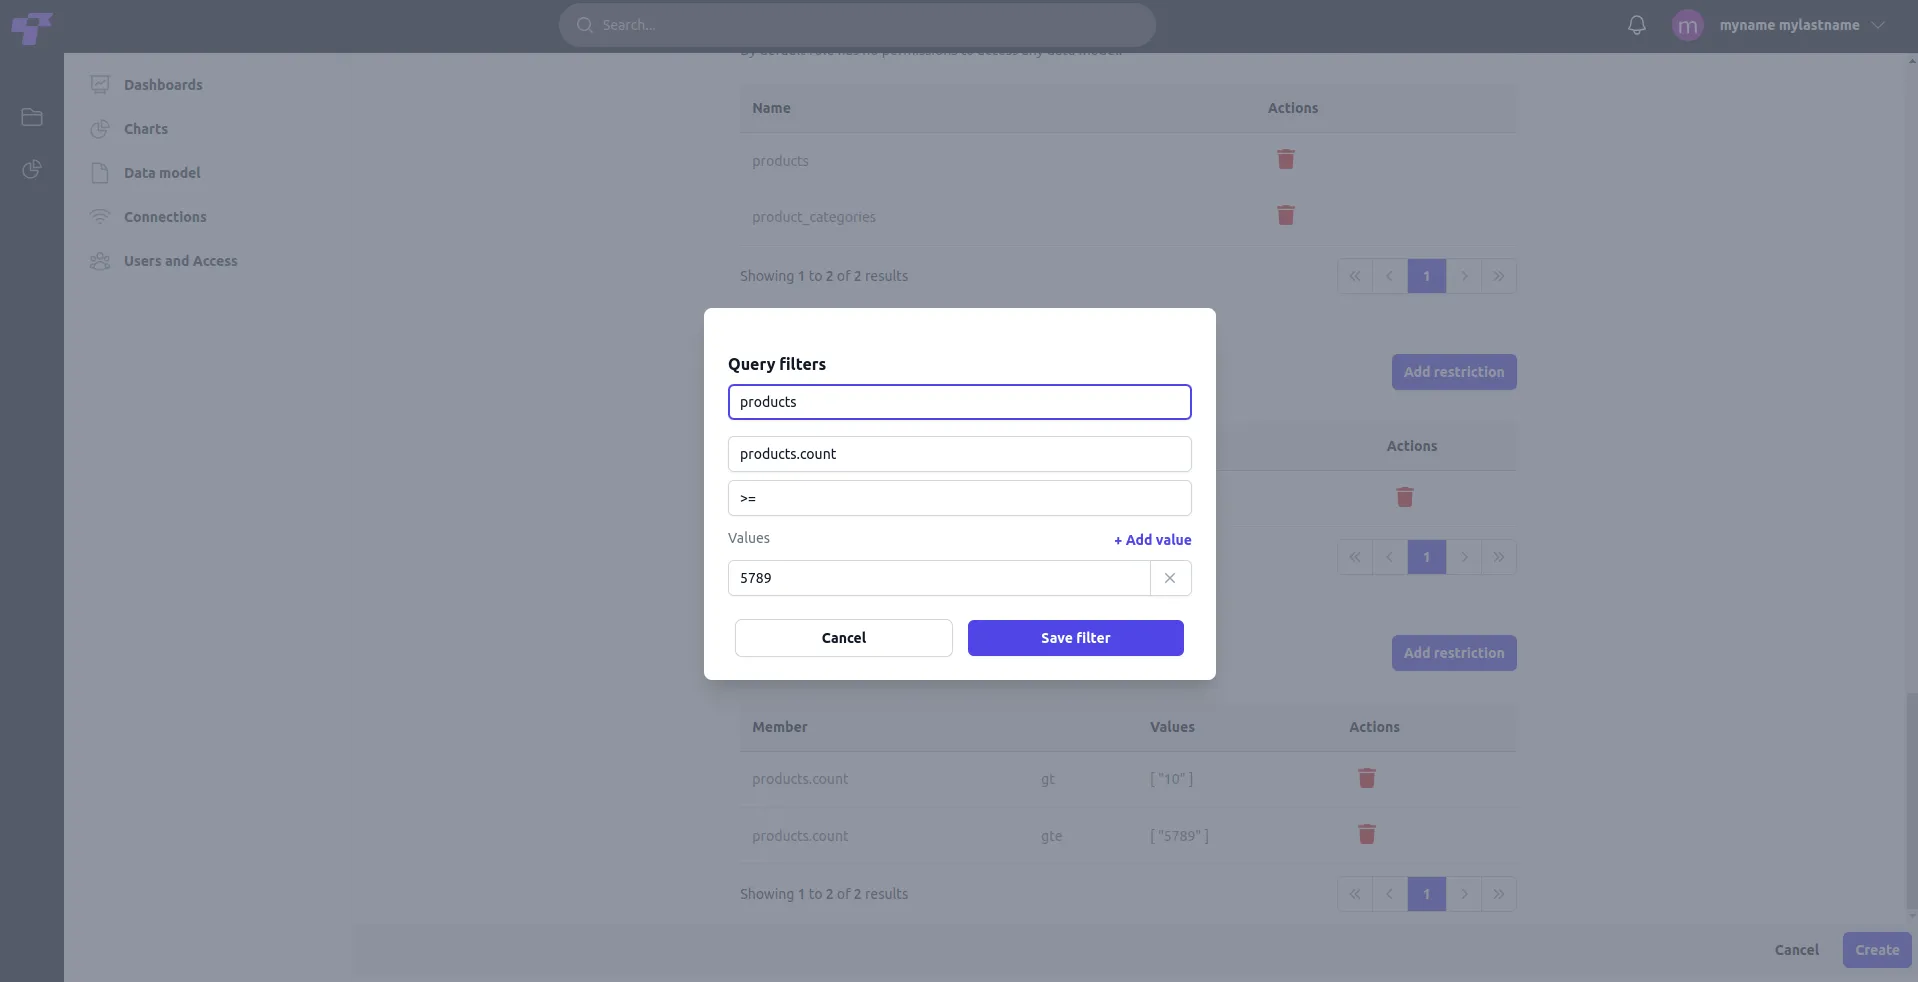
- Select table: Allows users to choose a table (data model) where row restrictions will be applied.
- Select member: Displays available fields (columns) from the selected table that can be used for filtering rows.
- Define operator and value: A dropdown to select the comparison operator for the restriction, such as equals, contains, not contains, >, >=, <, <=, or !=, etc.
- Add value: A text box to define the specific value(s) for the filter. Users can add multiple values using the + Add value option.
- Save filter: Saves the defined filter and applies it as a row restriction for the role.
Don't forget to press the "Create" button at the bottom right of the screen to save all changes.
Once created, the role will appear in the User Roles list under the Users and Access section, where it can be managed and updated as needed.