

Analytics setup
On this page
This page is for the people who set up Analytics for a team: creating a workspace, connecting a database, describing the data, and giving people access.
Some features need a Self-hosted license or Enterprise; they're marked with a note.
Create a workspace
A setup guide walks you through four steps: Name, Database, Data model and Finish.
- Click the pie chart icon at the top right of the screen, then Create workspace in the middle of the page, or New workspace at the top right.
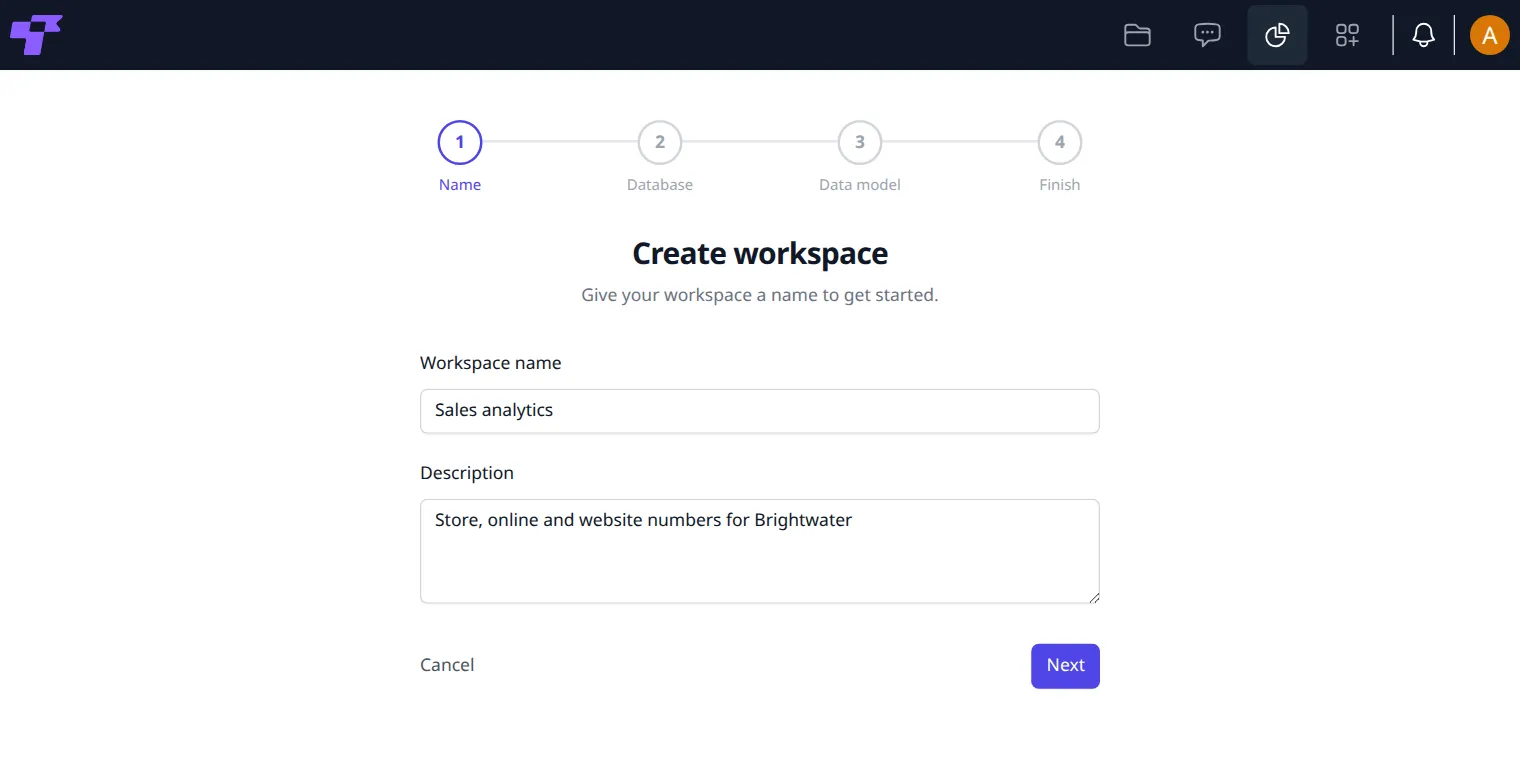
- Name: type the Workspace name and, optionally, a Description. Click Next. The workspace is created now.
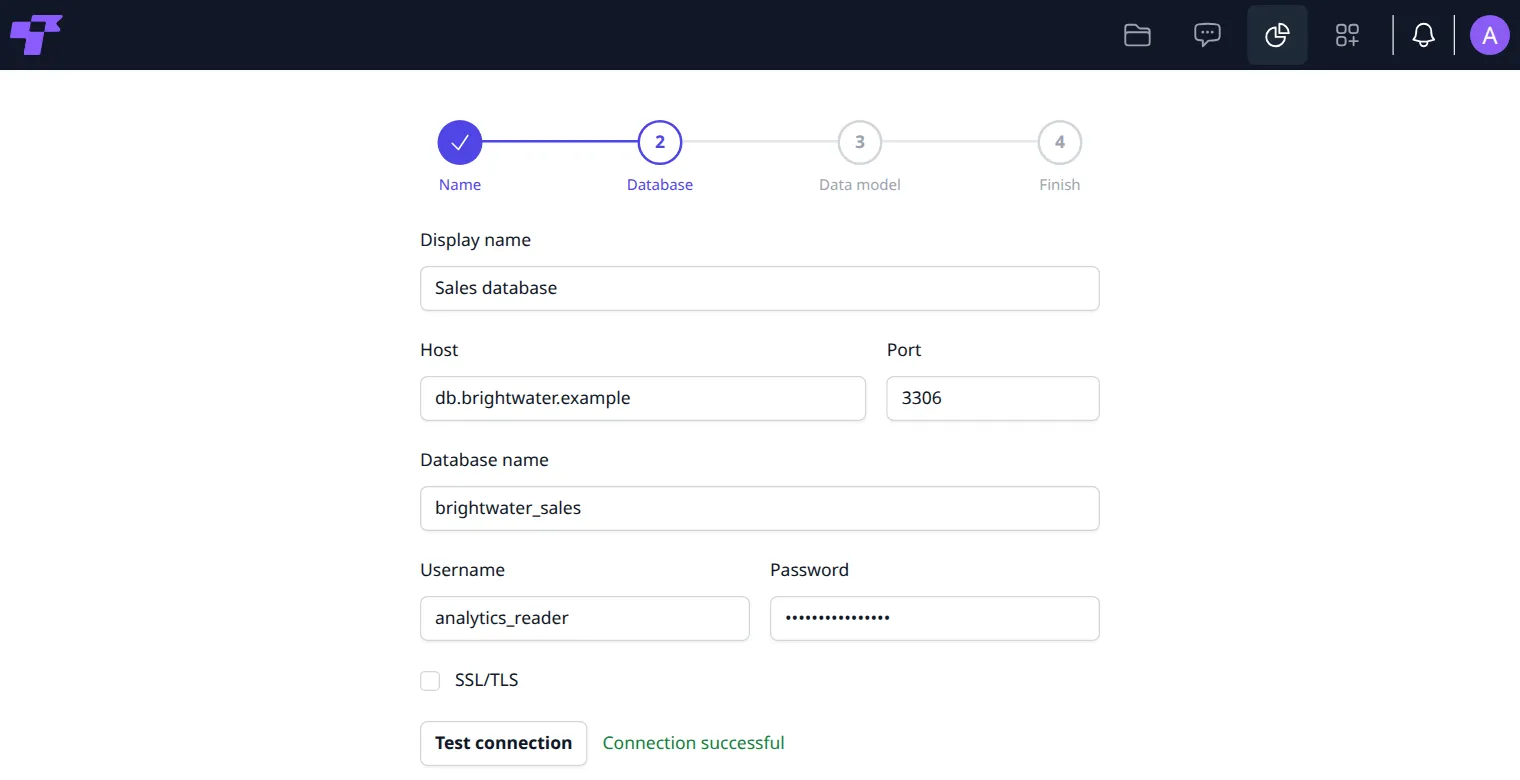
- Database: fill in the database details (see Set up a database connection). Click Test connection to check them, then Next. Next checks the connection too: if it fails, you stay on this step with "Could not connect to database" and the reason.
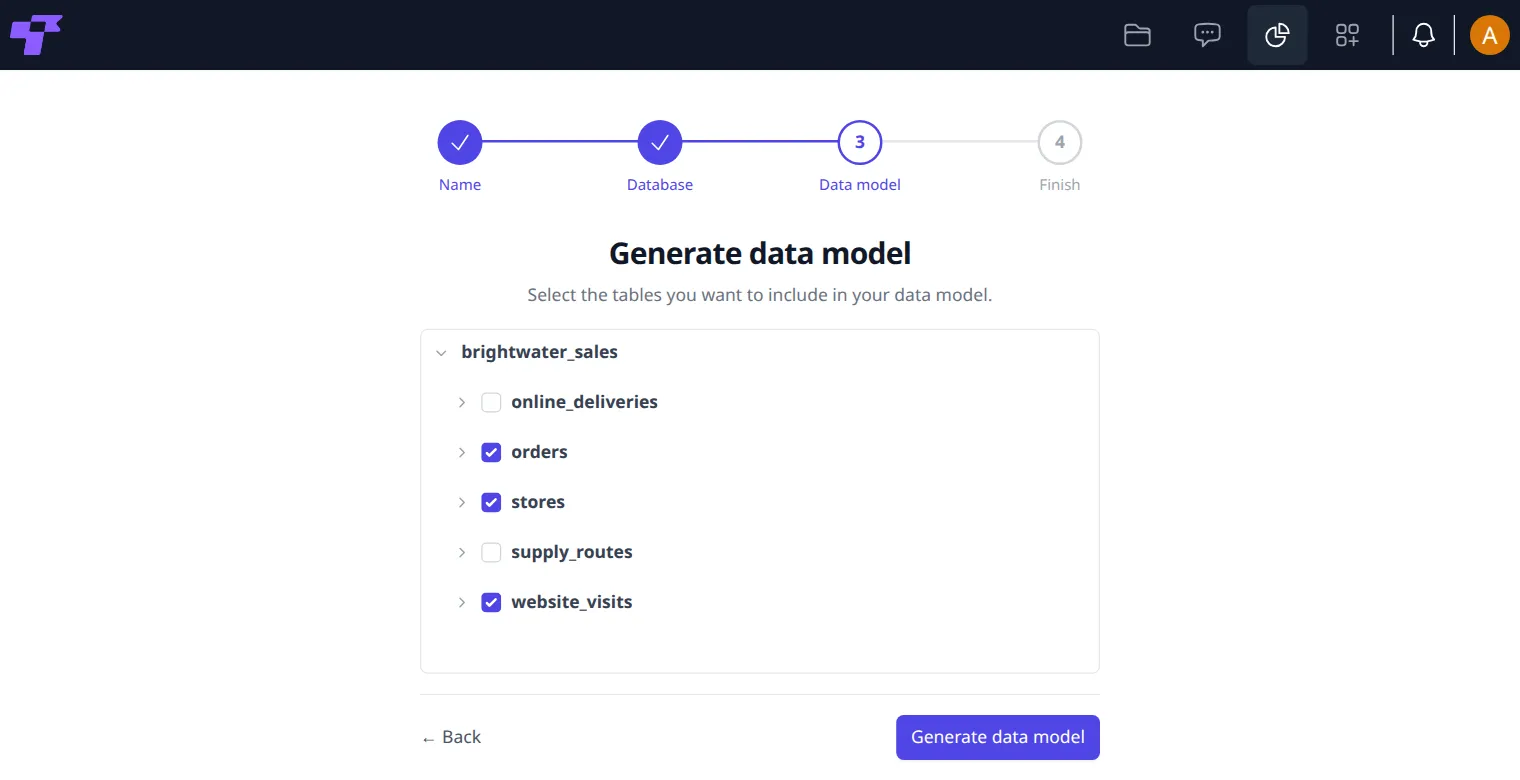
- Data model: click the database to see its tables. Tick a table to use all its columns, or click the table and tick only some columns. Click Generate data model.
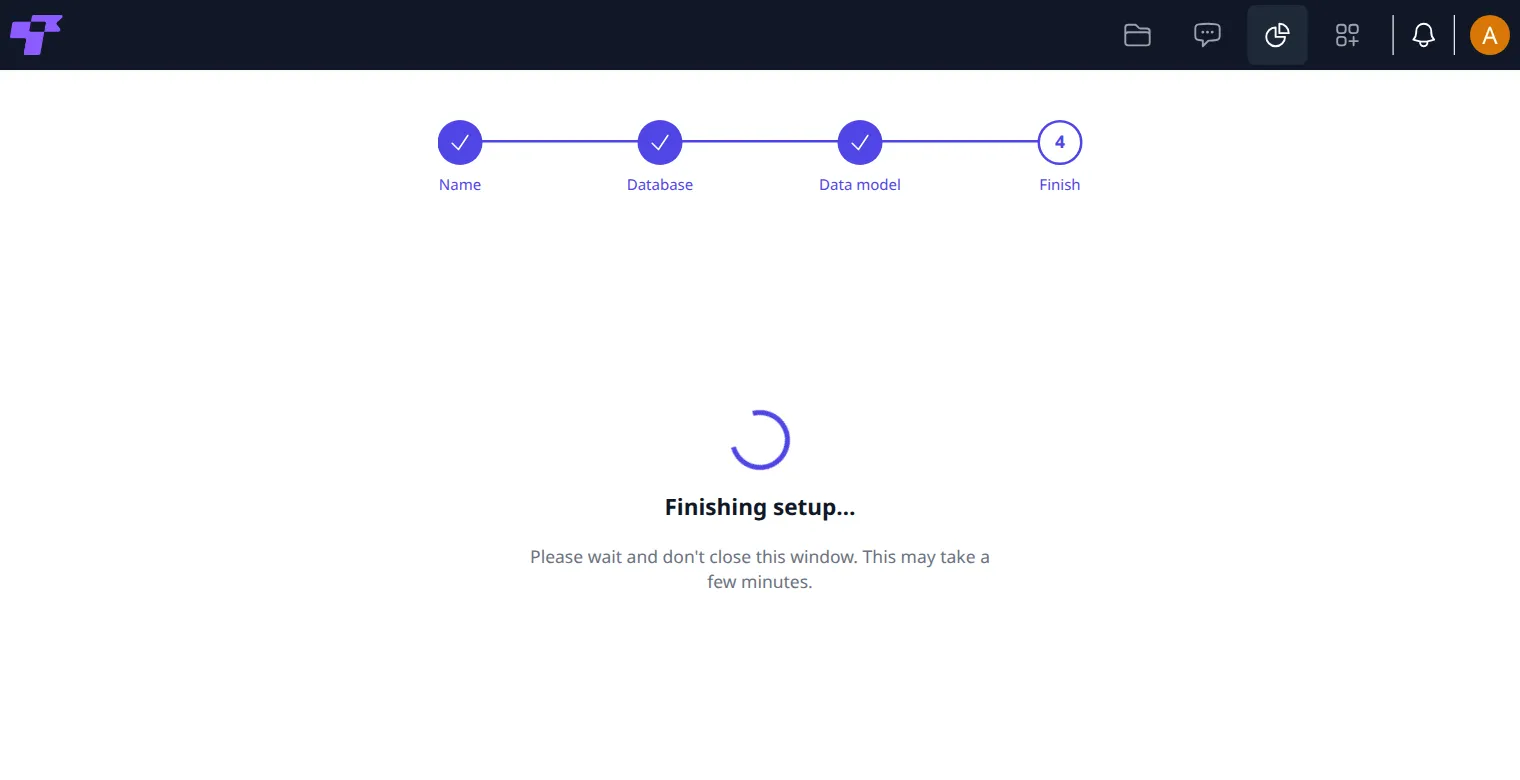
- Finish: "Finishing setup…" shows while Twigex prepares the workspace. Don't close the window. When it's done, the workspace opens on Dashboards.
Generate data model makes one dataset for each table, with each column as a dimension and a count of rows as the only measure. To add sums and averages, such as revenue, and readable titles, change the dataset (see Change a dataset).
You're the workspace's admin.
To delete a workspace, point at its card under Your workspaces and click the bin, then Delete in Delete workspace?. The bin shows only on workspaces you can delete.
Deleting a workspace deletes its connections, data model, charts and dashboards. It can't be undone. The data in your database isn't touched.
This needs a Self-hosted license or Enterprise. See plans.
You can have more than one workspace, for example one per team. Click New workspace at the top right of Your workspaces, and follow the same steps. In the Community Edition (free), there's one workspace, and a badge with a lock shows instead of New workspace.
Set up a database connection
Connections lists the databases the workspace reads from, with their address and database name.
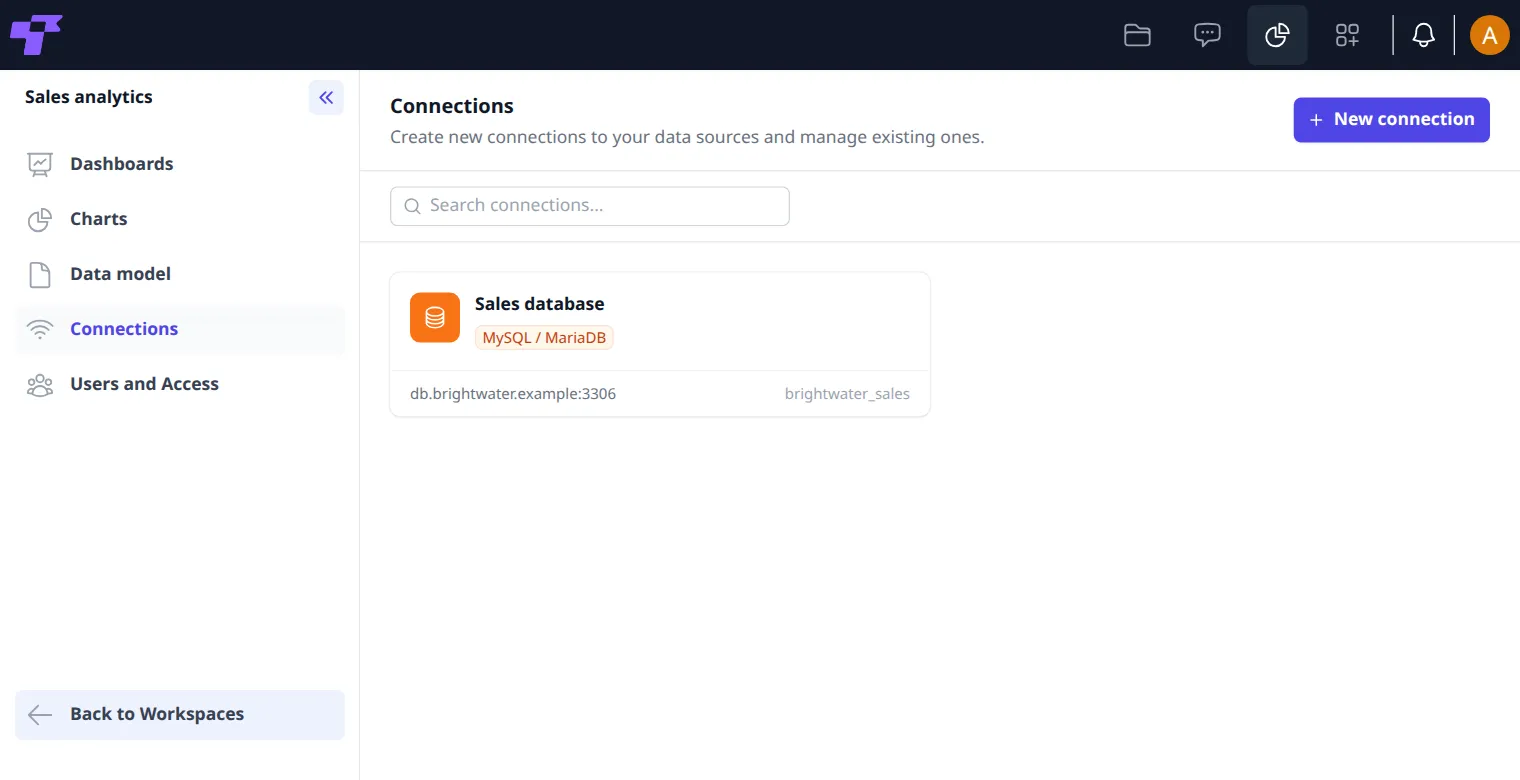
- Click New connection.
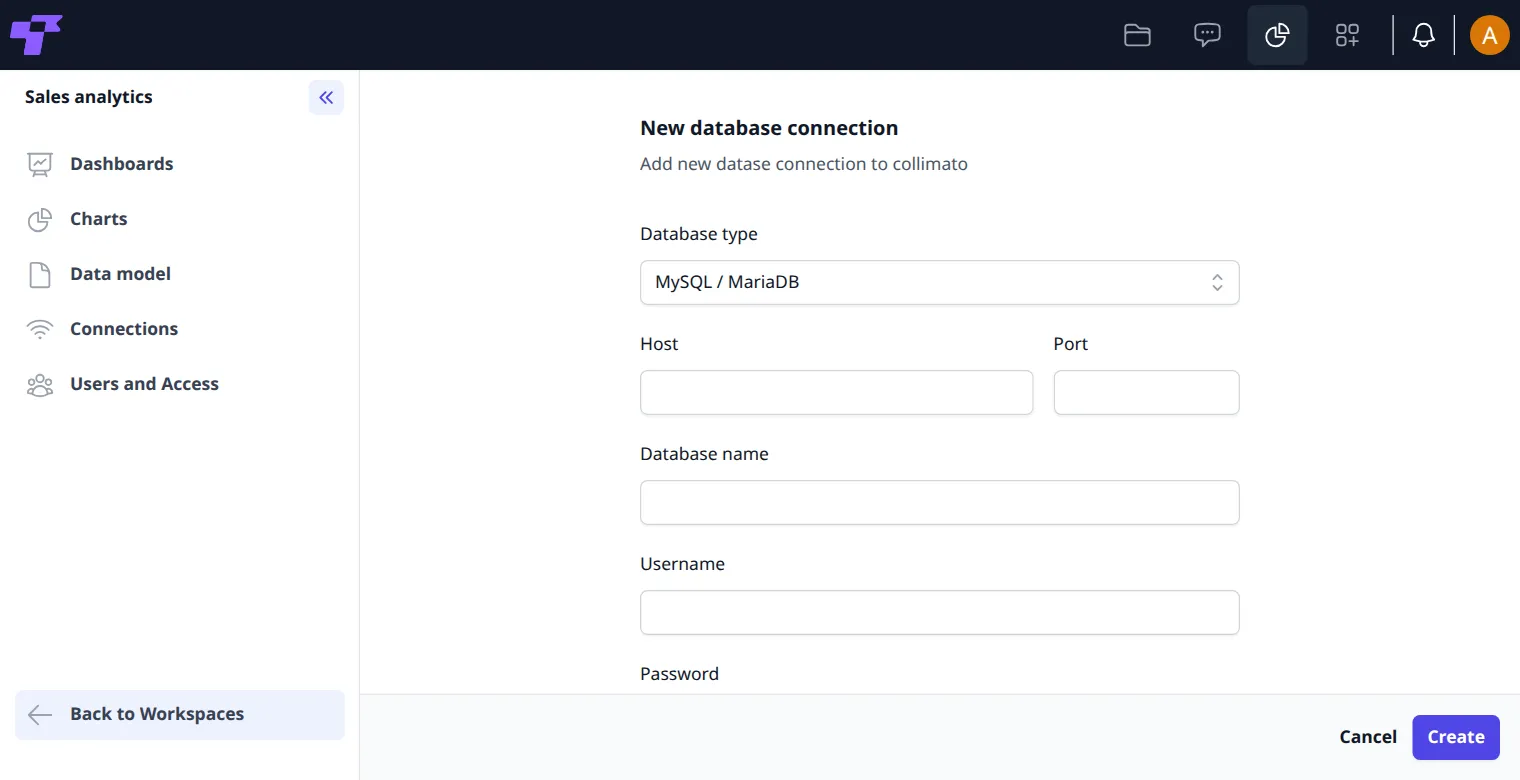
- Choose the Database type: MySQL / MariaDB or PostgreSQL.
- Fill in the Host, Port, Database name, Username and Password. The Port is empty at first: type it, usually 3306 for MySQL and MariaDB, or 5432 for PostgreSQL.
- Type a Display name, for example
Sales database. - SSL/TLS is ticked at first. If the database doesn't use encryption, untick it. Otherwise choose the Verification: None, Certificate, or Certificate and host. With Certificate or Certificate and host, paste the CA certificate of your certificate authority.
- Click Test connection. It shows Connection successful, or what went wrong, for example "The database rejected the username or password. Check both and try again."
- Click Create.
Use a database user that can only read. Analytics never changes your data. In MySQL or MariaDB, your database administrator can create one with, for example, CREATE USER 'analytics_reader'@'%' IDENTIFIED BY 'a-strong-password'; and GRANT SELECT, SHOW VIEW ON brightwater_sales.* TO 'analytics_reader'@'%';. Use your own database name and password.
To change or delete a connection, point at it. A pencil and a bin appear on its card.
- Change it: click the pencil, make your changes and click Update. The Password stays empty: leave it empty to keep the current password.
- Delete it: click the bin, then Delete in Delete connection?.
The confirmation warns that everything that uses the connection is affected. Deleting it can't be undone.
The data model
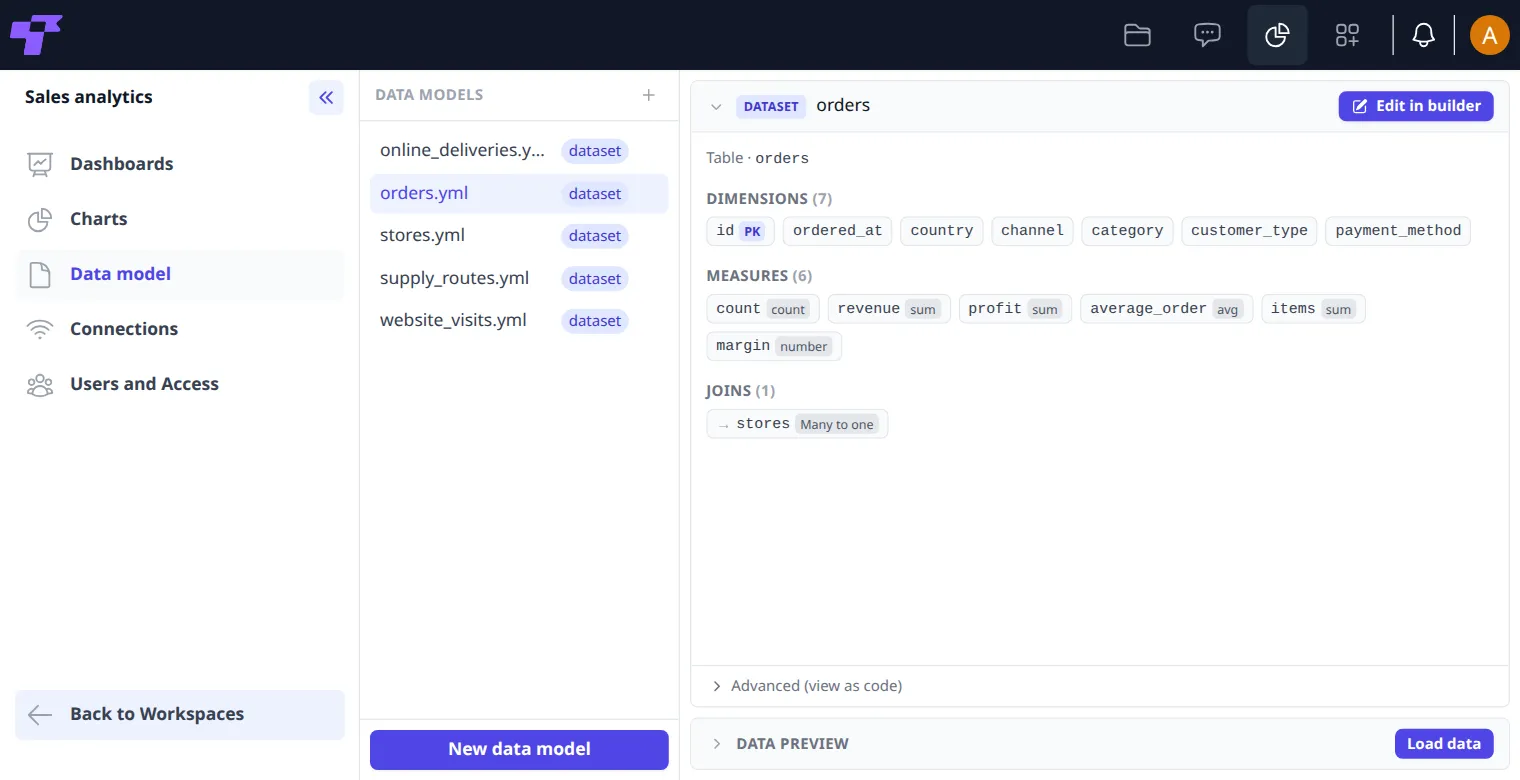
The data model describes your data in words that make sense for charts. Each dataset belongs to one database table and lists:
- Dimensions: the columns to group or filter by, such as country or category.
- Measures: the numbers to count or add up, such as revenue or number of orders.
- Joins: links to other datasets, for example from orders to the stores they belong to. With a join, a chart on orders can be split by store.
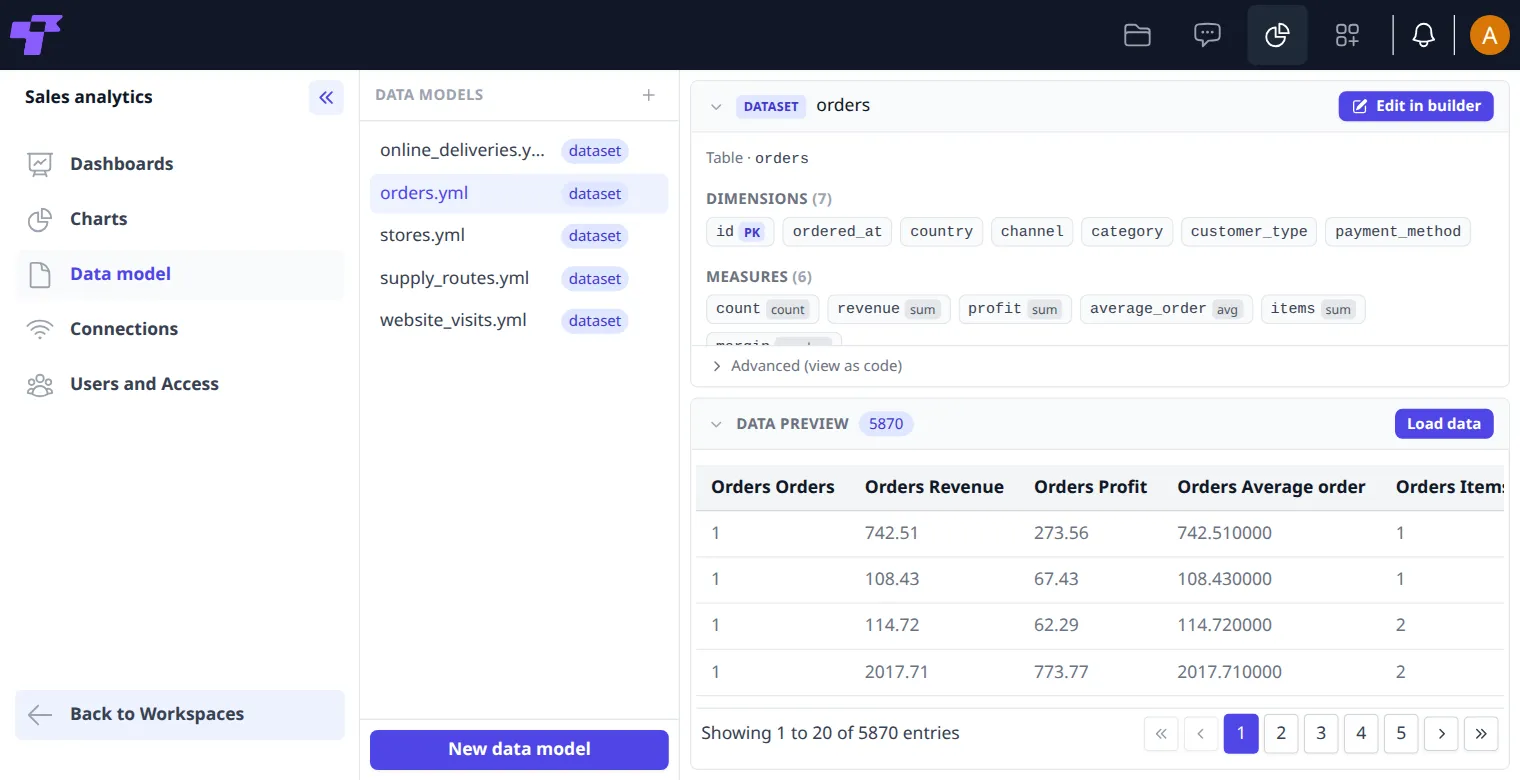
Click a dataset to see it. The dataset shows the database's column names, such as ordered_at; charts use the titles. Click Load data at the bottom to see the rows behind it.
Change a dataset
- Click the dataset, then Edit in builder. Edit dataset opens.
- Under Dimensions, tick the columns to include and choose their Type.
- Give each column a readable Title, for example
Order dateforordered_at. Titles are what people see in charts. - Under Measures, set what to count or add up: a name, how to calculate it (for example sum), the column and a title.
- Click Save.
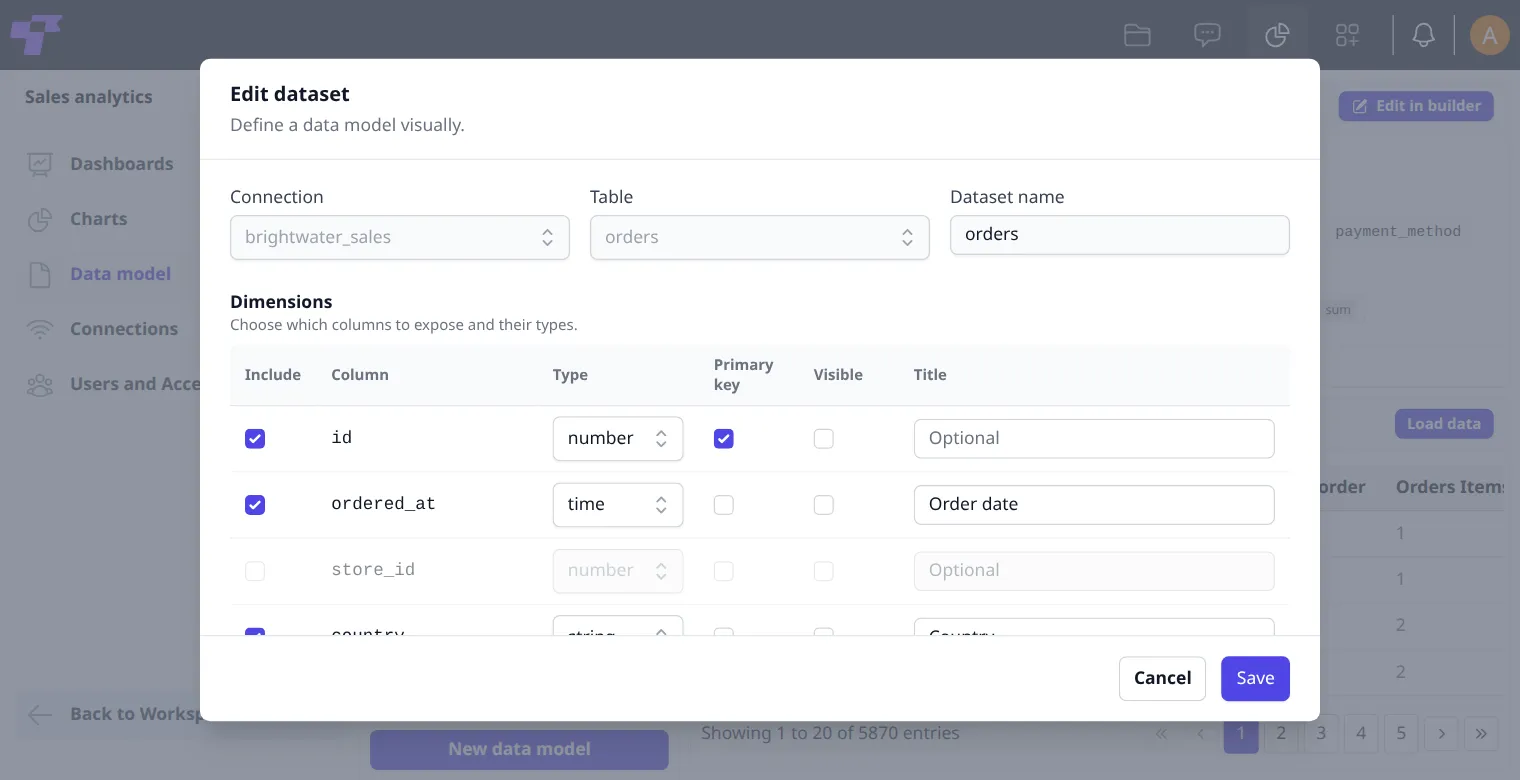
To write your own measure with SQL, click + Add custom measure under Custom measures. Type a name, choose the type, type a title, and write the SQL expression, for example ROUND(SUM({CUBE}.amount) / 1000, 1) for revenue in thousands. Click Save. The new measure can be used in charts straight away.
Under Joins, click + Add join to link the dataset to another one: choose the Dataset, the Relationship, This column and Other column.
Advanced (view as code) shows the dataset as YAML, for people who know Cube data models. You can only read it there; make changes with Edit in builder.
Add or delete a dataset
- Add: click New data model. In Build a dataset, choose the Connection (listed by its database name) and the Table, and change the Dataset name if you like. Choose the columns as in Change a dataset, and click Save. The new dataset starts with a count of rows as its measure.
- Delete: point at the dataset in the list and click the bin, then Delete in Delete data model?. If other datasets are joined to it, Twigex lists them instead, and Delete stays grayed out until you change or delete them.
The confirmation warns that charts that use a deleted dataset will not work. It can't be undone.
Users and access
Users and Access lists the workspace's users and their roles, its groups, and its roles.
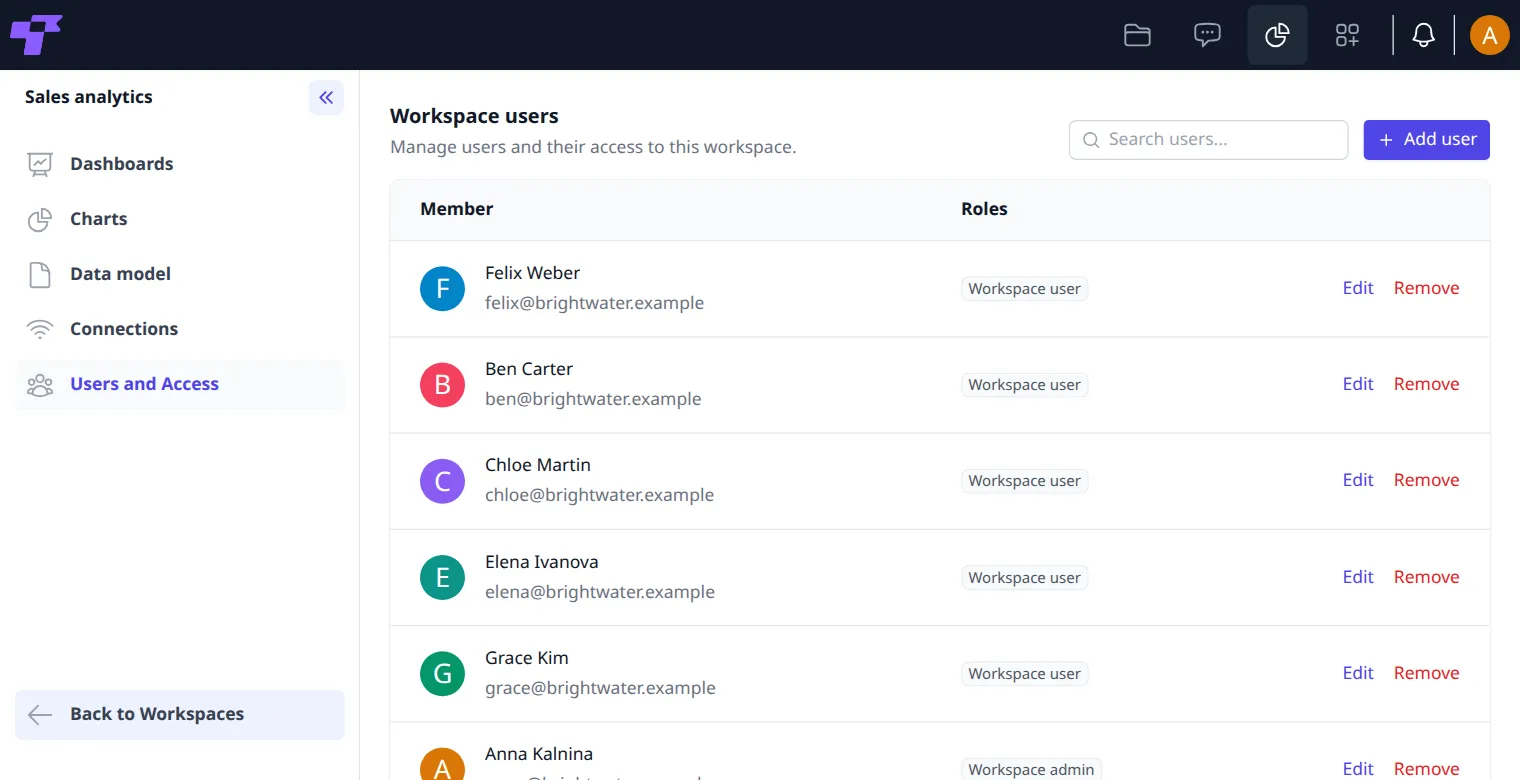
Add users
- Click Add user.
- Tick the people to add.
- Click Add.
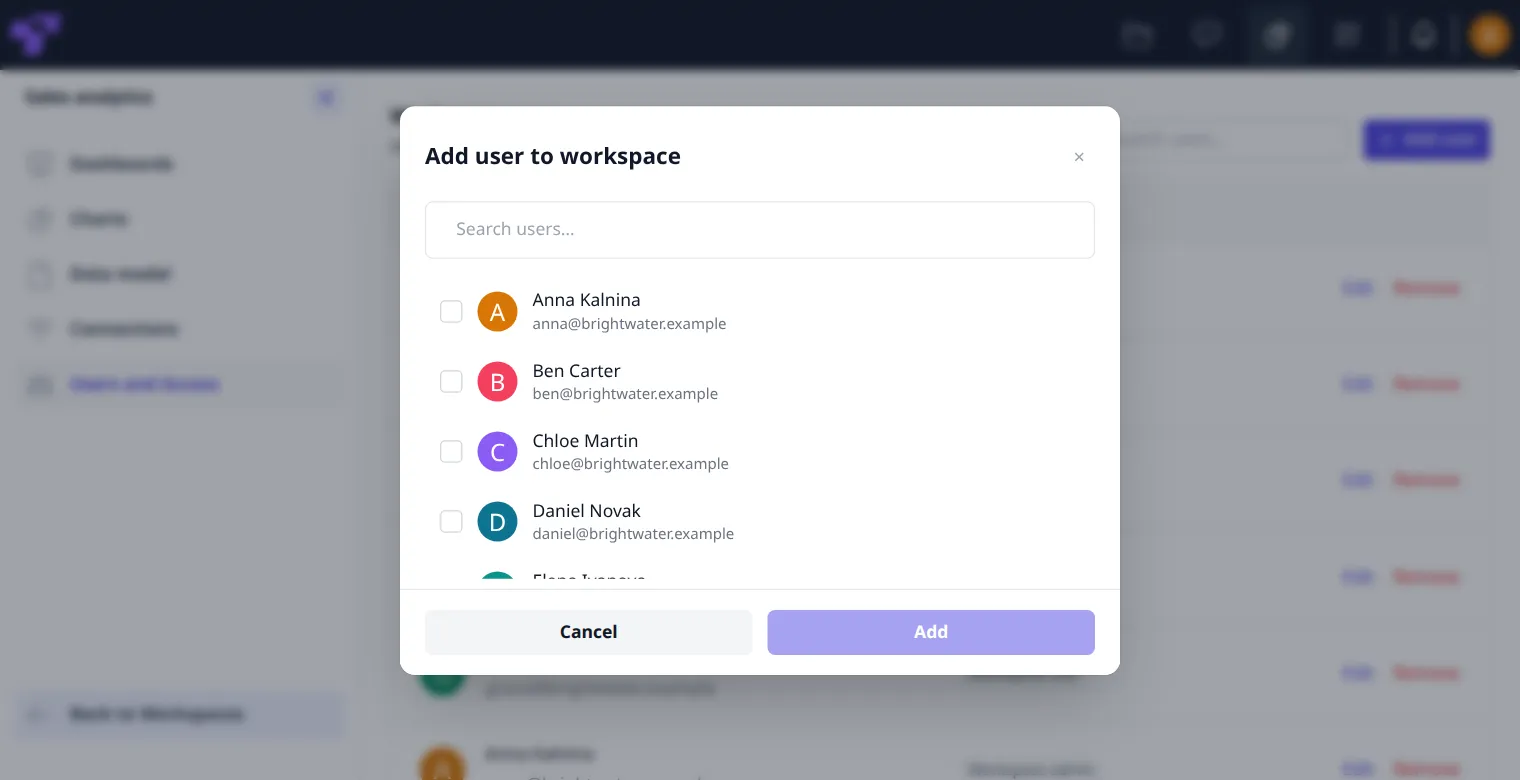
New users get the Workspace user role. To take someone out, click Remove next to them, then Remove in Remove user from workspace?.
Every workspace has two built-in roles:
- Workspace admin: can do everything in the workspace.
- Workspace user: looks at dashboards and charts, and can also create charts and dashboards and delete them. Sees Users and Access, but can't add, change or remove users. Doesn't see Data model or Connections.
This needs a Self-hosted license or Enterprise. See plans.
To change what someone can do:
- Click Edit next to them. Manage user roles opens.
- Tick their roles, for example Workspace admin, and untick the ones they shouldn't have. Someone can have several roles.
- Click Save.
Their roles are listed next to their name. For example, Grace Kim with Workspace admin also sees Data model and Connections, Edit in builder on datasets, and Add user, Edit, Remove, Add group and New role under Users and Access.
In the Community Edition (free), Save fails with "Failed to update user roles", and everyone you add stays a Workspace user.
Add groups
This needs a Self-hosted license or Enterprise. See plans.
You can give a whole group access at once. Groups are set up by an administrator in Settings (see Groups).
- Under Workspace groups, click Add group. Add group to workspace opens.
- Under Roles granted to members, click the roles the group's members get, for example Sales viewer.
- Click the group, for example Sales team. Type in Search groups... to find it.
- Click Add.
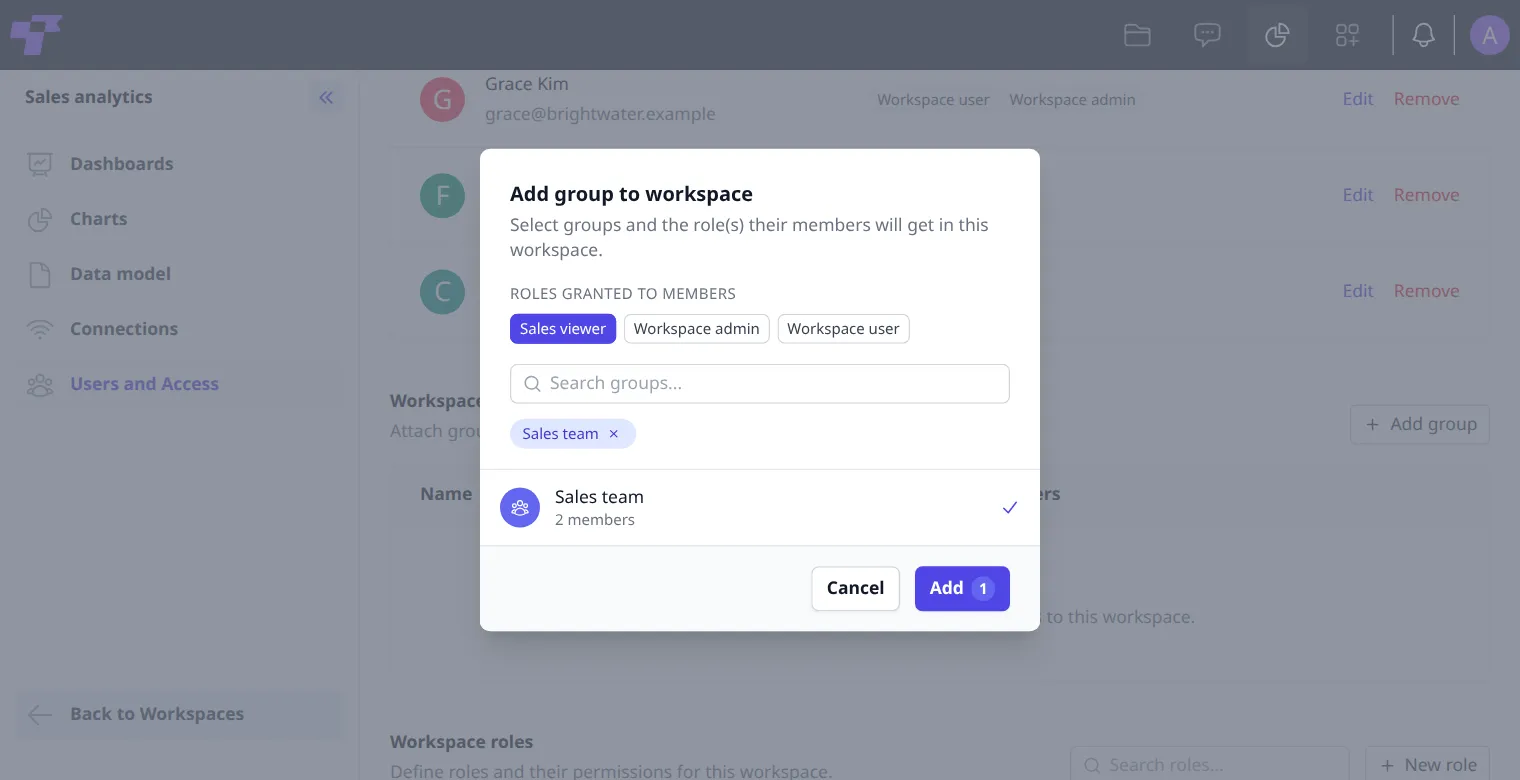
The group is listed under Workspace groups with its roles and number of members. Its members get access straight away: they find the workspace under Shared with me in Your workspaces, and they have the rights of the group's roles. They aren't listed under Workspace users.
To take the group out, click Remove next to it, then Delete in Remove group from workspace?. Members who only had access through the group lose it.
Create a role
This needs a Self-hosted license or Enterprise. See plans.
Create a role when a team needs other rights than the built-in roles give, for example a role that can view dashboards and create charts, but not change the data model.
- Under Workspace roles, click New role. Create role opens.
- Type the Role name, for example
Sales viewer, and optionally a Role description. - Turn on Auto update if datasets created later should be given to this role automatically.
- Tick what the role can do. Each section has Select all to tick all its permissions:
- Connections: Create connections, View connections, Edit connections, Delete connections.
- Charts: Create charts, View charts, Edit charts, Delete charts.
- Dashboards: Create dashboards, View dashboards, Edit dashboards, Delete dashboards.
- Dashboard Filters: Create dashboard filters, View dashboard filters, Edit dashboard filters, Delete dashboard filters.
- Data Models: Create data models, View data models, Edit data models, Delete data models.
- Users: Add users, Delete users, Assign roles to users.
- Roles: Create roles, View roles, Edit roles, Delete roles.
- Choose the data the role can see (see Choose which data a role can see). Without it, the role sees no data.
- Click Create.
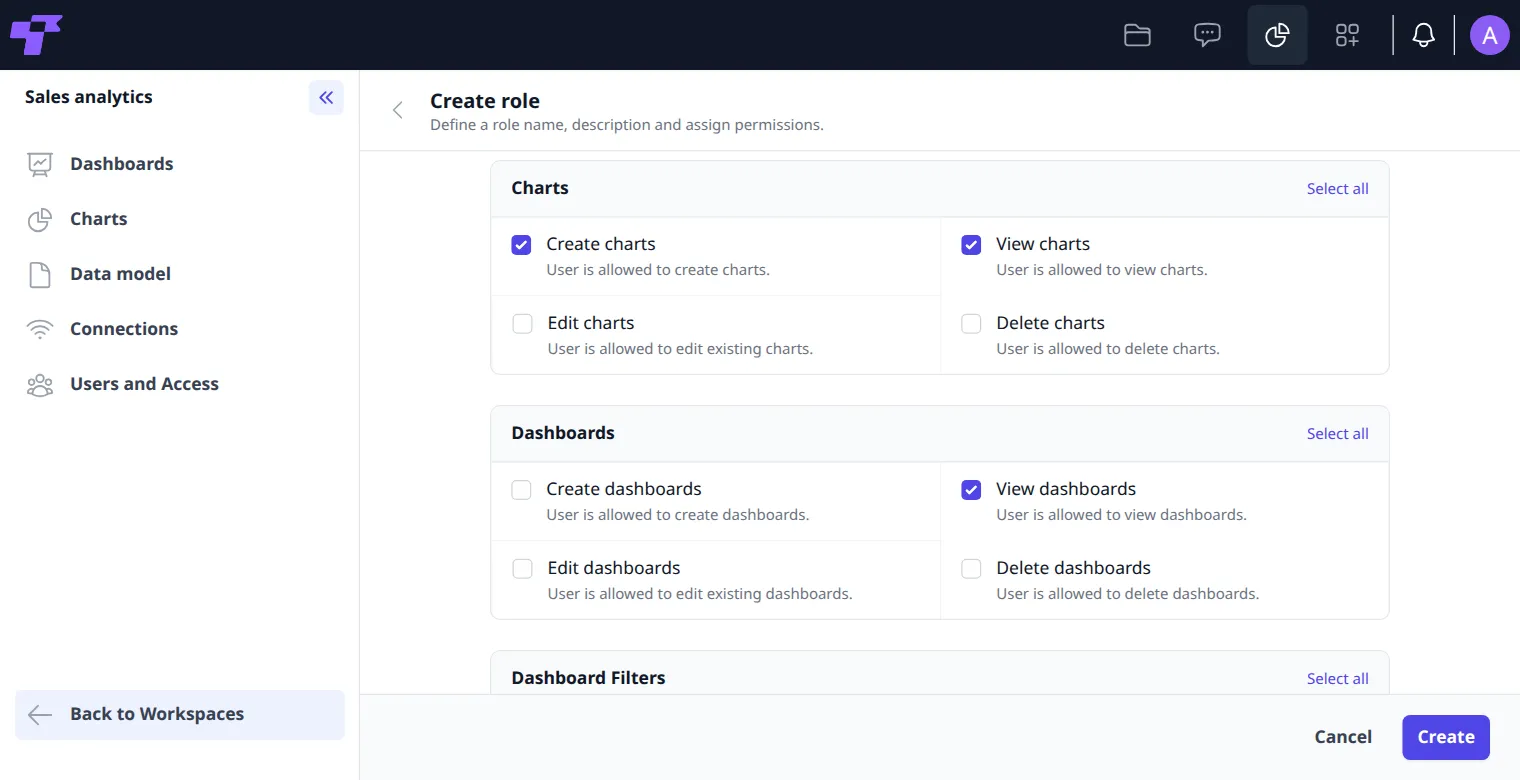
For example, Sales viewer with View dashboards, View charts, Create charts and View dashboard filters sees Dashboards, Charts and Users and Access on the left. It can look at dashboards and filter them, and create charts, but has no Edit dashboard, Data model or Connections. Under Users and Access, it only sees the list of users.
Give the role to people with Edit next to them (see Users and access), or to a group (see Add groups).
To change a role, click Edit next to it, make your changes and click Update. To delete a role you created, click Delete next to it, then Delete in Delete role?. The built-in roles can be changed, but not deleted.
If someone has several roles, they get everything any of their roles allows. A restriction (see below) applies to them only if every role that gives them the dataset has it: a second role that gives the same dataset without the restriction lifts it.
Choose which data a role can see
This needs a Self-hosted license or Enterprise. See plans.
A role you create sees no data until you give it datasets. You can also hide columns and limit the rows, for example to one country.
- Under Workspace roles, click Edit next to the role.
- Under Data model permissions, click Add data model permission, tick the datasets in Assign data model to role, for example orders, and click Add.
- To hide a column, under Column restrictions, click Add restriction. Click the dataset under Data model, then the column, for example Profit, and click Add.
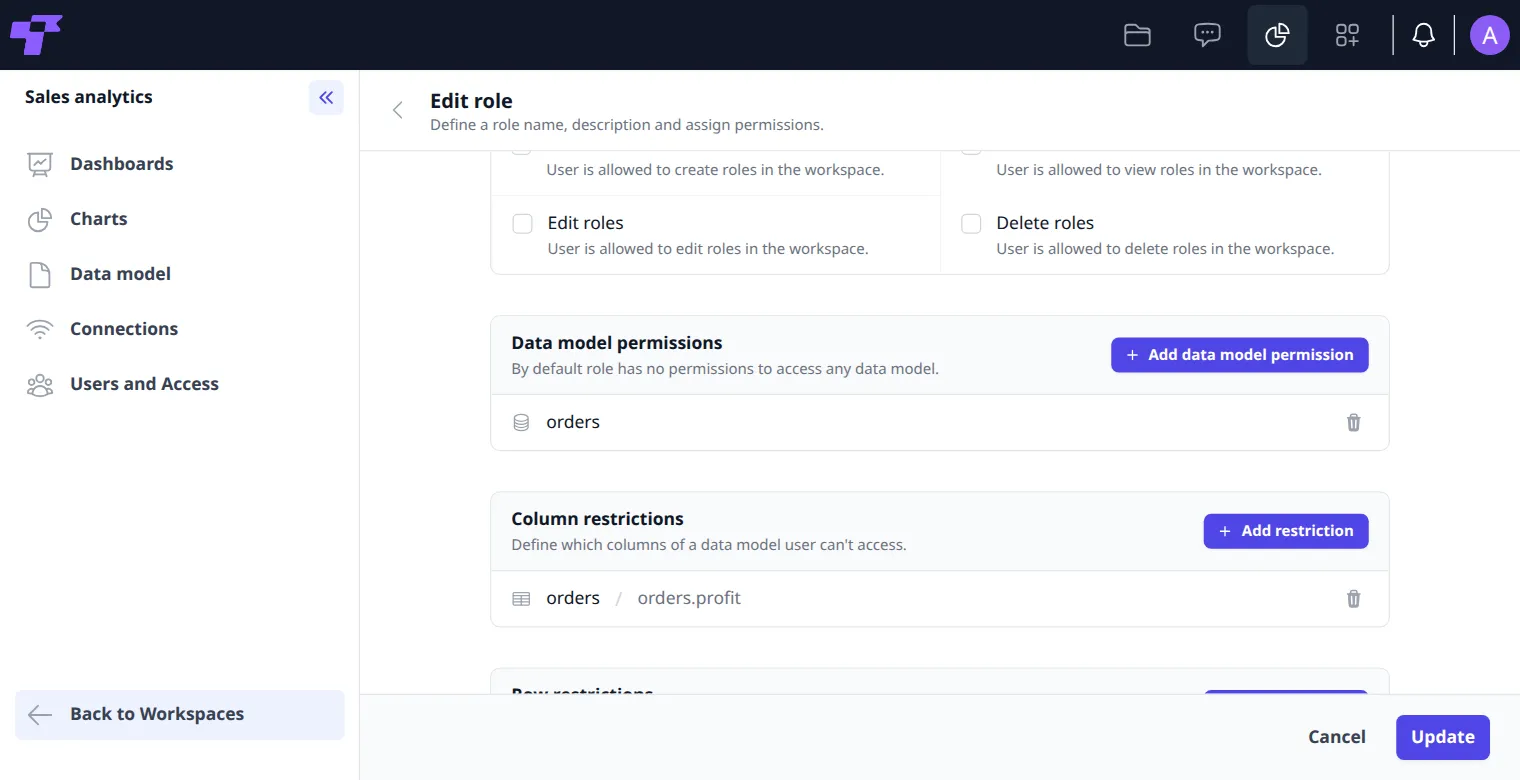
- To limit the rows, under Row restrictions, click Add restriction. Click the dataset, the column, for example orders.country, and the operator: is set, is not set, equals, not equals, contains, not contains, >, >=, < or <=. Click + Add value, type the value, for example
Latvia, and click Save. Save is at the bottom of the dialog: scroll down to it. - Click Update.
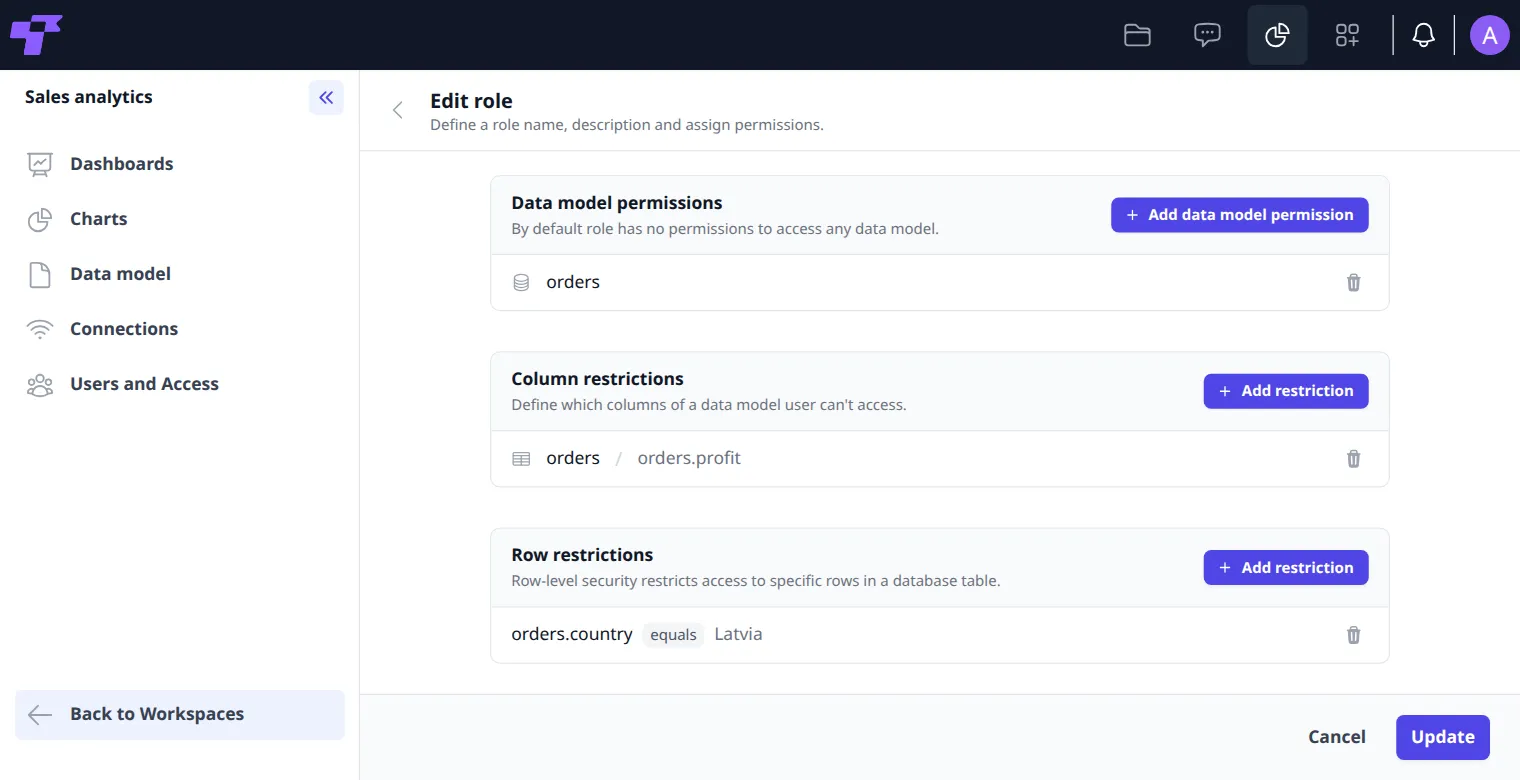
What people with the role see:
- Datasets: only the ones you gave the role. The chart builder lists only these, without the columns of joined datasets. Charts on other datasets show "You do not have permission to access this data."
- Hidden columns: they disappear from the measures and dimensions in the chart builder, and from the data preview.
- Rows: every chart, dashboard filter and drill-down shows only the allowed rows. With Country equals Latvia, Sales overview shows only Latvia's numbers, and the Country filter offers only Latvia.
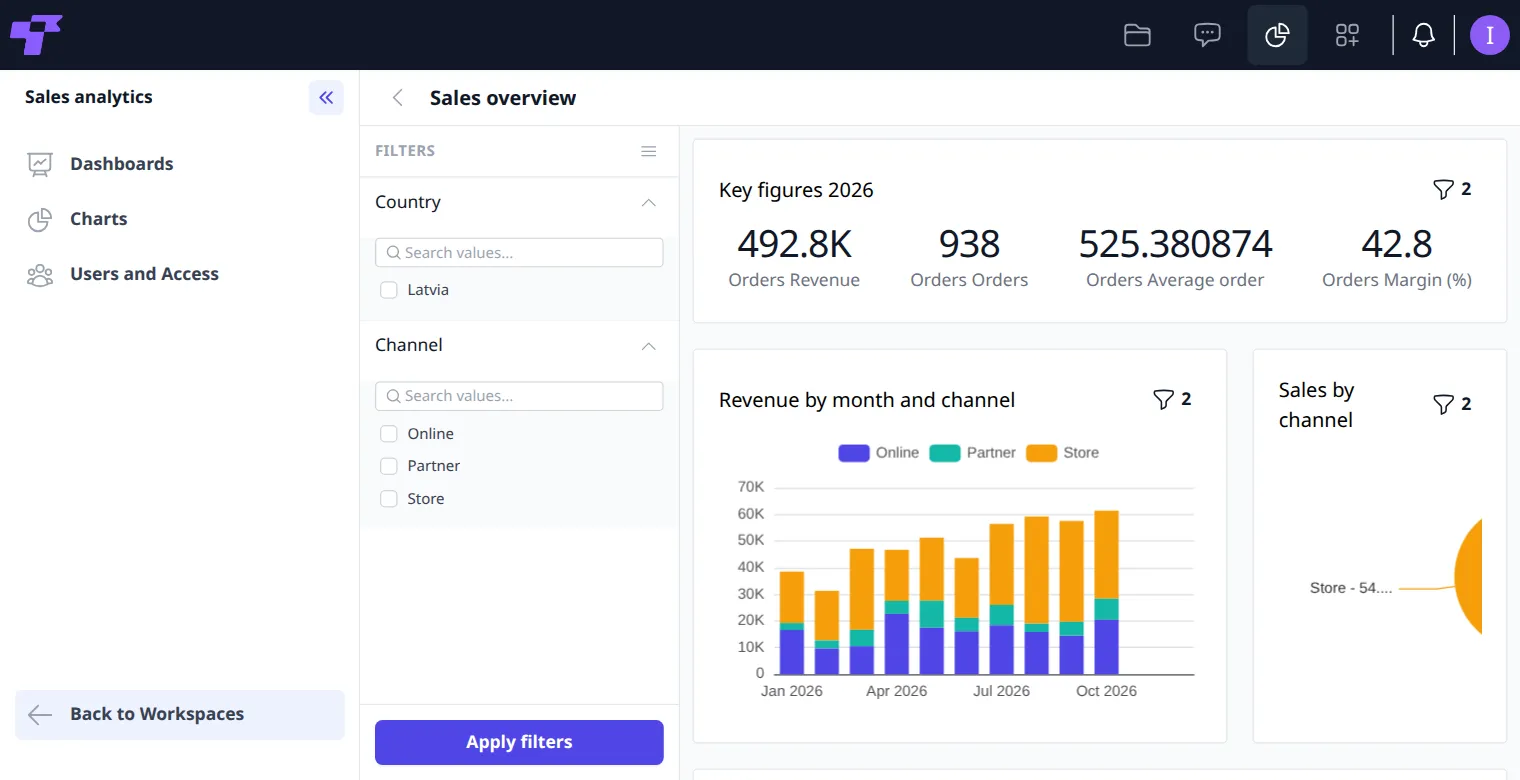
Hiding a column doesn't hide measures calculated from it. With Profit hidden, Margin (%), which is calculated from the profit, still shows. Hide those measures too.
If something doesn't work
- Test connection fails: check the host, port, database name, user and password, and that the database accepts connections from the Twigex server. If the database doesn't use encryption, untick SSL/TLS; it's ticked at first.
- Failed to update user roles: changing roles needs a Self-hosted license or Enterprise.
- There's no Create workspace or New workspace: in the Community Edition (free), there's one Analytics workspace, and it exists already. More workspaces need a Self-hosted license or Enterprise.
- Charts say "You do not have permission to access this data.": none of the person's roles gives them that dataset. Give one of their roles the dataset under Data model permissions (see Choose which data a role can see).
- With a license, every Workspace user sees "You do not have permission to access this data." and no filters on dashboards: the built-in Workspace user role starts without datasets and without View dashboard filters. Click Edit next to Workspace user, add the datasets under Data model permissions, tick View dashboard filters, and click Update.
- A row or column restriction doesn't apply to someone: another of their roles gives them the same dataset without the restriction, for example Workspace user. Take that role away from them.